Evaluating Shikimic Acid as an Analyte Protectant for Pesticides in Food

While using matrix-matched calibration standards can mitigate matrix effects and increase reporting accuracy, this approach is time-consuming, labor intensive, and sometimes limited by the availability of suitable blank matrix. The use of analyte protectants (AP) in gas chromatography is an intriguing alternative because it is much simpler in practice and can allow good results to be achieved with solvent-based calibration standards [1]. Analyte protectants, such as the sugar derivative shikimic acid, work by binding strongly to active sites in the inlet, which effectively blocks these sites from interacting with target compounds. This prevents analyte loss, improves transfer to the column, minimizes degradation in peak shape and response, and can potentially improve accuracy and reliability for low-level analysis.
Since using matrix-matched calibration standards is not feasible in all situations, a series of experiments was conducted to evaluate the effects of using an analyte protectant with solvent-based calibration standards on recovery and critical peak characteristics (area, symmetry, width, and tailing) for a variety of pesticides. The experiments were (1) recovery of 40 pesticides in kale samples; (2) response of captan in apple, strawberry, kale, grape, and celery samples; and (3) response of 40 pesticides in kale and strawberry samples. For all tests, the analyte protectant was shikimic acid (1 mg/mL), and 1 µL of it was co-injected with 1 µL of sample (for samples without analyte protectant, 1 µL of acetonitrile was co-injected).
Experiment 1: Recovery of 40 Pesticides in Kale
To determine if 1.0 mg/mL shikimic acid analyte protectant could increase pesticide recovery in matrix, kale samples were fortified at 10 and 50 ppb with a 40-compound QuEChERS performance standards kit (cat.# 31152). Quantification was done using matrix-matched calibration standards, solvent-based calibration standards with shikimic acid, and solvent-based calibration standards without shikimic acid. As shown in Figures 1 and 2, when using solvent standards, the analyte protectant did help more pesticides fall into the desired recovery range (70-120%), particularly at the higher spike level. However, matrix-matched calibration still outperformed solvent calibration with analyte protectant at both spike levels, and this was especially pronounced at the lower spike level.
Figure 1: Distribution of 40 Pesticides at 50 ppb in Kale Across Percent Recovery Brackets
Figure 2: Distribution of 40 Pesticides at 10 ppb in Kale Across Percent Recovery Brackets
Experiment 2: Response of Captan in Multiple Matrices
Captan is a commonly analyzed, yet challenging, GC-amenable pesticide, so it was chosen for a more detailed evaluation of the performance of shikimic acid as an analyte protectant. For this experiment, two sets of samples were prepared so that captan could be evaluated alone and when in the presence of other pesticides. A captan-only standard (cat.# 32583) was spiked at 10 ppm into solvent, apple, strawberry, kale, grape, and celery samples, and a multi-pesticide standard containing captan (cat.# 31152) was also spiked at 10 ppm into the same sample types. Samples were analyzed both with and without 1 µL sandwich injections of 1 mg/mL shikimic acid. Peak response was first visually compared in an XIC; then, area and other key peak characteristics were evaluated in detail using the MS/MS data.
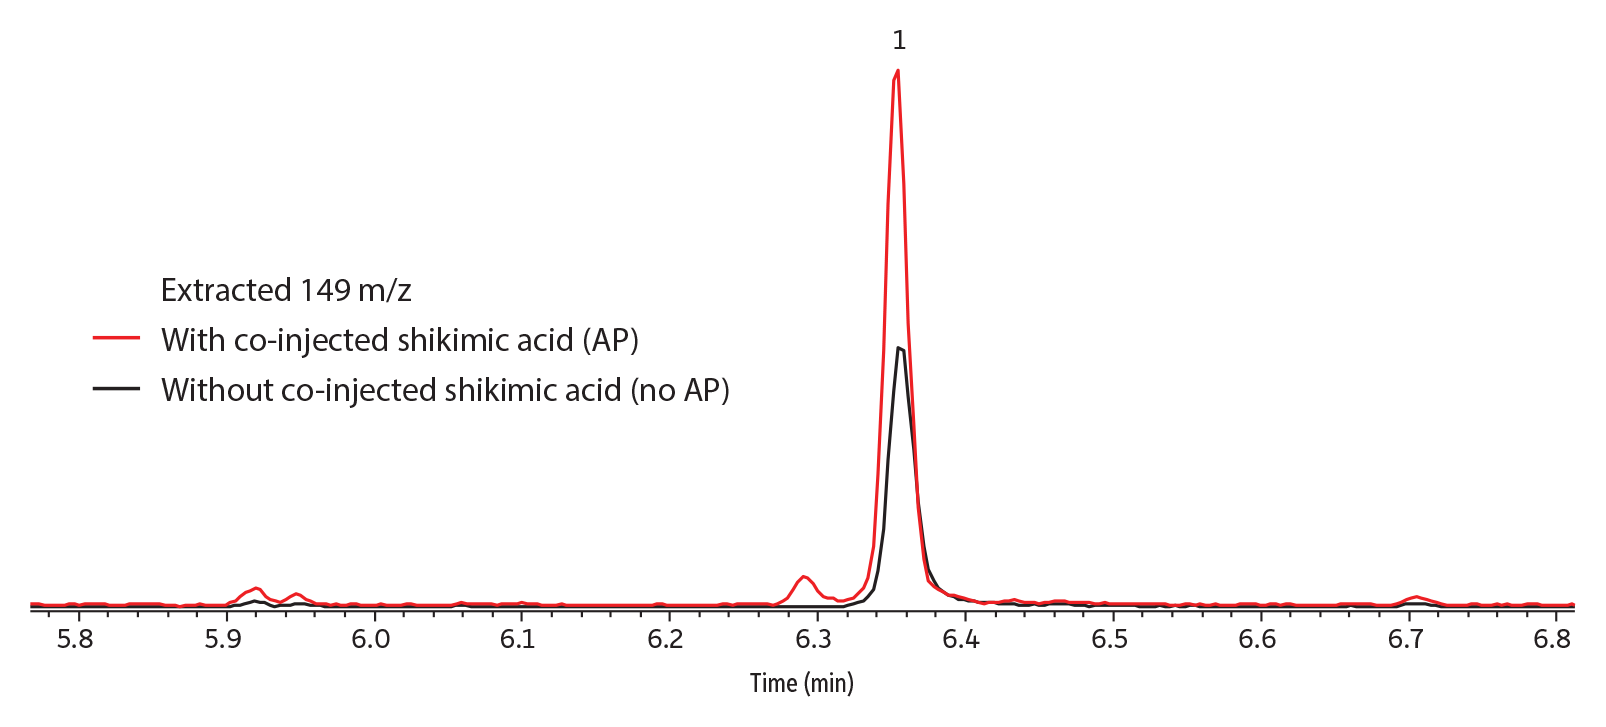
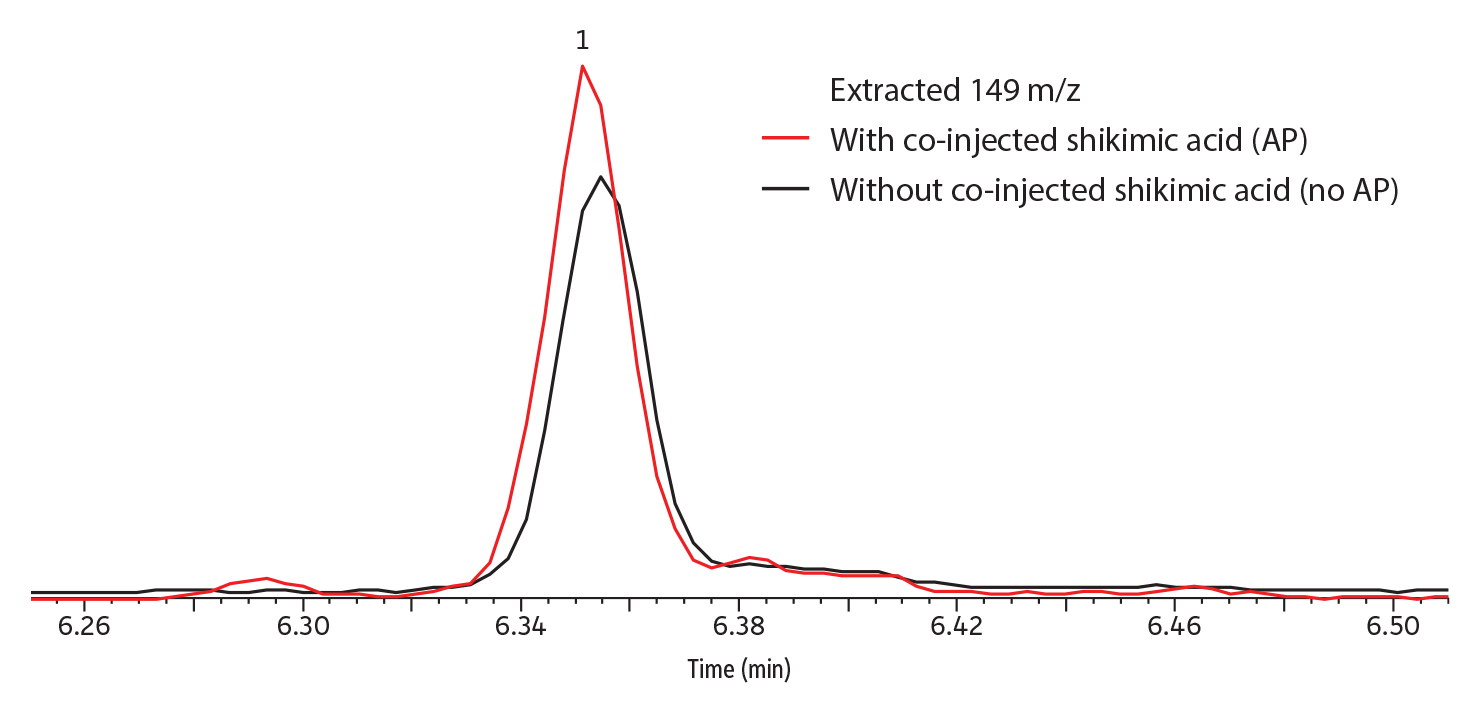
Qualitatively, peak response (abundance) was greatly improved by the presence of shikimic acid analyte protectant when captan was in solvent (Figure 3); somewhat improved when it was in strawberry (Figure 4) or grape; and not improved when in kale, apple, or celery (data not shown for grape, kale, apple, and celery). No dramatic differences in peak shape were observed; however, the taller peaks tended to have narrower widths.
Figure 3: Shikimic acid analyte protectant considerably improved peak response for captan in solvent.
| Peaks | tR (min) | |
|---|---|---|
| 1. | Captan | 6.36 |
| Column | Low-pressure GC column kit (factory-coupled restrictor column [5 m x 0.18 mm ID] and Rtx-5ms analytical column [15 m, 0.53 mm ID, 1 µm plus 1 m integrated transfer line on the outlet end]) (cat.# 11800) |
|---|---|
| Standard/Sample | Captan in QuEChERS performance standards kit (cat.# 31152) |
| Diluent: | Acetonitrile |
| Conc.: | 10 µg/mL |
| Injection | |
| Inj. Vol.: | 1 µL split (split ratio 10:1) |
| Liner: | Topaz 4.0 mm ID single taper inlet liner w/ wool (cat.# 23447) |
| Inj. Temp.: | 250 °C |
| Oven | |
| Oven Temp.: | 70 °C (hold 1 min) to 320 °C at 35 °C/min (hold 2 min) |
| Carrier Gas | He, constant flow |
| Flow Rate: | 2 mL/min |
| Detector | MS | ||||||||
|---|---|---|---|---|---|---|---|---|---|
| Mode: | Scan | ||||||||
| Scan Program: | |||||||||
| |||||||||
| Transfer Line Temp.: | 290 °C | ||||||||
| Analyzer Type: | Quadrupole | ||||||||
| Source Temp.: | 325 °C | ||||||||
| Electron Energy: | 70 eV | ||||||||
| Tune Type: | PFTBA | ||||||||
| Ionization Mode: | EI | ||||||||
| Instrument | Thermo Scientific TSQ 8000 Triple Quadrupole GC-MS | ||||||||
| Sample Preparation | The standard was diluted to 10 ppm in acetonitrile in a 2 mL short-cap, screw-thread vial (cat.# 21143) and capped with a short-cap, screw-vial closure (cat.# 24495). | ||||||||
| Notes | Injections were performed as sandwich co-injections with 1 µL shikimic acid (1 mg/mL in acetonitrile with 1% water) as an analyte protectant (with AP injection) or with acetonitrile as the control (without AP injection). | ||||||||
Figure 4: For captan in strawberry, shikimic acid analyte protectant provided some improvement for peak response.
| Peaks | tR (min) | |
|---|---|---|
| 1. | Captan | 6.36 |
| Column | Low-pressure GC column kit (factory-coupled restrictor column [5 m x 0.18 mm ID] and Rtx-5ms analytical column [15 m, 0.53 mm ID, 1 µm plus 1 m integrated transfer line on the outlet end]) (cat.# 11800) |
|---|---|
| Standard/Sample | Captan in QuEChERS performance standards kit (cat.# 31152) |
| Diluent: | Acetonitrile |
| Conc.: | 10 µg/mL |
| Injection | |
| Inj. Vol.: | 1 µL split (split ratio 10:1) |
| Liner: | Topaz 4.0 mm ID single taper inlet liner w/ wool (cat.# 23447) |
| Inj. Temp.: | 250 °C |
| Oven | |
| Oven Temp.: | 70 °C (hold 1 min) to 320 °C at 35 °C/min (hold 2 min) |
| Carrier Gas | He, constant flow |
| Flow Rate: | 2 mL/min |
| Detector | MS | ||||||||
|---|---|---|---|---|---|---|---|---|---|
| Mode: | Scan | ||||||||
| Scan Program: | |||||||||
| |||||||||
| Transfer Line Temp.: | 290 °C | ||||||||
| Analyzer Type: | Quadrupole | ||||||||
| Source Temp.: | 325 °C | ||||||||
| Electron Energy: | 70 eV | ||||||||
| Tune Type: | PFTBA | ||||||||
| Ionization Mode: | EI | ||||||||
| Instrument | Thermo Scientific TSQ 8000 Triple Quadrupole GC-MS | ||||||||
| Sample Preparation | 10 g of homogenized strawberries were extracted with 10 mL of acetonitrile and QuEChERS EN 15662 salts (cat.# 25850). After centrifugation, 1 mL of supernatant was added to a 2 mL dSPE vial containing magnesium sulfate and PSA (cat.# 26124) for cleanup. The cleaned extract was spiked at 10 ppm with a multi-pesticide standard containing captan in a 2 mL short-cap, screw-thread vial (cat.# 21143) and capped with a short-cap, screw-vial closure (cat.# 24495). | ||||||||
| Notes | Injections were performed as sandwich co-injections with 1 µL shikimic acid (1 mg/mL in acetonitrile with 1% water) as an analyte protectant (with AP injection) or with acetonitrile as the control (without AP injection). | ||||||||
For a statistical evaluation of the effect of analyte protectant on important peak characteristics, the peak area, symmetry, width, and tailing values provided by the TraceFinder 4.1 EFS software were compared in different combinations by t-test. The data sets for the comparisons were as follows:
- Captan/Solvent—captan spiked alone into solvent.
- Captan/Solvent/Samples—captan spiked alone into both solvent and all five sample matrices.
- Multi-pesticide/Solvent/Samples—mixed standard containing 40 pesticides, including captan, spiked into both solvent and all five sample matrices.
- All—all data from the above three data sets combined.
Quantitatively, peak width was the only characteristic that was statistically improved (p<0.05) across all four data sets. Results showed that the use of shikimic acid as an analyte protectant did result in narrower peaks. Peak area and tailing were also significantly improved, but only in the All and Captan/Solvent/Sample data sets. There was no statistical difference for peak symmetry in any data set.
Table I: Evaluation of the Effect of Analyte Protectant on Captan Peak Characteristics (Statistically significant differences [p<0.05; 95% confidence level] are shown in bold.)
| Peak Area | Symmetry | Peak Width | Tailing | ||
| All | |||||
| Without AP (n=39) | average | 178137 | 92.02 | 1.32 | 1.34 |
| SD | 42461 | 5.70 | 0.06 | 0.18 | |
| RSD | 24% | 6% | 5% | 14% | |
| With AP (n=29) | average | 216295 | 93.43 | 1.24 | 1.19 |
| SD | 55321 | 4.59 | 0.03 | 0.17 | |
| RSD | 26% | 5% | 3% | 14% | |
| t-test | 0.002 | 0.277 | 0.000 | 0.001 | |
| Multipesticide/Solvent/Samples | |||||
| Without AP (n=9) | average | 222614 | 94.13 | 1.31 | 1.26 |
| SD | 47642 | 2.91 | 0.07 | 0.15 | |
| RSD | 21% | 3% | 5% | 12% | |
| With AP (n=9) | average | 273640 | 94.42 | 1.26 | 1.16 |
| SD | 44426 | 4.10 | 0.03 | 0.11 | |
| RSD | 16% | 4% | 2% | 9% | |
| t-test | 0.032 | 0.863 | 0.040 | 0.130 | |
| Captan/Solvent/Samples | |||||
| Without AP (n=30) | average | 164794 | 91.38 | 1.33 | 1.36 |
| SD | 30630 | 6.20 | 0.06 | 0.19 | |
| RSD | 19% | 7% | 5% | 14% | |
| With AP (n=20) | average | 190490 | 92.98 | 1.23 | 1.20 |
| SD | 37687 | 4.83 | 0.03 | 0.19 | |
| RSD | 20% | 5% | 3% | 16% | |
| t-test | 0.016 | 0.336 | 0.000 | 0.004 | |
| Captan/Solvent | |||||
| Without AP (n=5) | average | 195568 | 90.56 | 1.35 | 1.32 |
| SD | 51267 | 5.69 | 0.06 | 0.17 | |
| RSD | 26% | 6% | 5% | 13% | |
| With AP (n=5) | average | 187051 | 90.32 | 1.23 | 1.35 |
| SD | 34072 | 5.41 | 0.05 | 0.21 | |
| RSD | 18% | 6% | 4% | 15% | |
| t-test | 0.339 | 0.335 | 0.002 | 0.657 | |
Experiment 3: Response of 40 Pesticides in Kale and Strawberry
In a final experiment, the effect of shikimic acid analyte protectant on peak area for 40 pesticides was evaluated. For this assessment, multi-pesticide standard (cat.# 31152) was spiked at 10 ppm into solvent, kale, and strawberry samples, which were analyzed both with and without shikimic acid, and the area results were then compared.
In general, the addition of analyte protectants resulted in larger peak areas. When individual pesticides across all solvent and sample injections were evaluated by t-test, 21 out of 40 analytes had significantly improved areas. When separated by matrix, 14/40 were improved in solvent; 1/40 were improved in kale; and 0/40 were improved in strawberry. Overall, the data showed that the analyte protectant could increase peak area in solvent, but it did not offer much advantage for pesticides in matrix. Finally, the data sets were also evaluated by paired t-test using the averages from the triplicate runs for the whole set of pesticides. In this test, all data sets were found to be significantly different.
Table II: Evaluation of the Effect of Shikimic Acid Analyte Protectant on Average Peak Area for Pesticides in Solvent, Kale, and Strawberry (n = 3)
| All | Solvent | |||||
| Without AP | With AP | t-test | Without AP | With AP | t-test | |
| 2-Phenylphenol | 2.0E+06 | 2.5E+06 | 0.007 | 1.9E+06 | 2.4E+06 | 0.048 |
| Acephate | 6.5E+05 | 9.3E+05 | 0.002 | 6.6E+05 | 9.3E+05 | 0.006 |
| Azinphos-methyl | 4.5E+05 | 7.2E+05 | 0.004 | 4.0E+05 | 6.0E+05 | 0.055 |
| BHC, gamma- | 1.2E+06 | 1.4E+06 | 0.179 | 1.4E+06 | 1.4E+06 | 0.567 |
| Bifenthrin | 5.3E+06 | 5.9E+06 | 0.273 | 5.2E+06 | 5.9E+06 | 0.102 |
| Captan | 2.2E+05 | 2.7E+05 | 0.032 | 2.3E+05 | 2.8E+05 | 0.063 |
| Carbaryl | 5.5E+06 | 7.3E+06 | 0.004 | 5.0E+06 | 7.4E+06 | 0.007 |
| Chlorothalonil | 7.0E+05 | 8.7E+05 | 0.009 | 7.2E+05 | 9.2E+05 | 0.018 |
| Chlorpyrifos | 9.9E+05 | 1.1E+06 | 0.125 | 1.0E+06 | 1.2E+06 | 0.131 |
| cis-Permethrin | 7.5E+05 | 8.6E+05 | 0.243 | 8.0E+05 | 8.0E+05 | 0.974 |
| Coumaphos | 2.6E+05 | 3.0E+05 | 0.202 | 2.7E+05 | 2.8E+05 | 0.919 |
| Cyprodinil | 5.1E+05 | 6.1E+05 | 0.054 | 5.0E+05 | 6.1E+05 | 0.060 |
| DDT, p,p'- | 3.0E+06 | 3.5E+06 | 0.068 | 3.0E+06 | 3.7E+06 | 0.044 |
| Deltamethrin | 3.7E+05 | 4.2E+05 | 0.206 | 3.5E+05 | 4.1E+05 | 0.068 |
| Diazinon | 8.9E+05 | 1.0E+06 | 0.026 | 9.1E+05 | 1.1E+06 | 0.162 |
| Dichlofluanid | 1.8E+06 | 2.1E+06 | 0.088 | 1.8E+06 | 2.2E+06 | 0.143 |
| Dichlorvos | 1.8E+05 | 2.0E+05 | 0.341 | 1.5E+05 | 2.1E+05 | 0.265 |
| Dicofol | 1.7E+06 | 2.4E+06 | 0.002 | 1.6E+06 | 2.5E+06 | 0.027 |
| Dimethoate | 5.1E+05 | 6.5E+05 | 0.012 | 4.6E+05 | 6.6E+05 | 0.002 |
| Endosulfan sulfate | 4.4E+05 | 4.9E+05 | 0.231 | 4.7E+05 | 4.9E+05 | 0.556 |
| Endrin | 1.4E+05 | 1.7E+05 | 0.046 | 1.4E+05 | 1.8E+05 | 0.044 |
| Fenhexamid | 4.7E+05 | 6.1E+05 | 0.007 | 4.3E+05 | 6.1E+05 | 0.007 |
| Fenpropathrin | 1.8E+05 | 2.0E+05 | 0.334 | 2.0E+05 | 2.0E+05 | 0.965 |
| Fenthion | 1.7E+06 | 2.0E+06 | 0.044 | 1.7E+06 | 2.0E+06 | 0.132 |
| Folpet | 7.7E+05 | 9.9E+05 | 0.009 | 7.5E+05 | 1.0E+06 | 0.021 |
| Imazalil | 1.1E+05 | 1.5E+05 | 0.011 | 1.1E+05 | 1.4E+05 | 0.016 |
| Iprodione | 9.4E+04 | 1.2E+05 | 0.056 | 8.5E+04 | 1.2E+05 | 0.060 |
| Malathion | 1.5E+06 | 1.8E+06 | 0.013 | 1.4E+06 | 1.9E+06 | 0.025 |
| Metalaxyl | 4.4E+05 | 5.2E+05 | 0.036 | 4.5E+05 | 5.4E+05 | 0.100 |
| Methamidophos | 9.8E+04 | 1.1E+05 | 0.738 | 5.9E+04 | 4.8E+04 | 0.858 |
| Methiocarb | 1.4E+06 | 1.7E+06 | 0.036 | 1.4E+06 | 1.7E+06 | 0.093 |
| Mevinphos | 1.5E+06 | 1.6E+06 | 0.371 | 1.5E+06 | 1.5E+06 | 0.875 |
| Myclobutanil | 6.3E+05 | 7.7E+05 | 0.044 | 6.1E+05 | 7.6E+05 | 0.036 |
| Omethoate | 9.1E+05 | 1.3E+06 | 0.002 | 7.7E+05 | 1.3E+06 | 0.001 |
| Phosalone | 1.1E+05 | 1.4E+05 | 0.091 | 1.2E+05 | 1.3E+05 | 0.666 |
| Pirimiphos methyl | 6.9E+05 | 7.9E+05 | 0.099 | 6.9E+05 | 8.2E+05 | 0.069 |
| Propargite | 1.4E+05 | 1.8E+05 | 0.044 | 1.3E+05 | 1.7E+05 | 0.052 |
| Thiabendazole | 5.0E+06 | 6.5E+06 | 0.018 | 4.1E+06 | 5.5E+06 | 0.070 |
| trans-Permethrin | 8.6E+05 | 9.2E+05 | 0.530 | 9.3E+05 | 8.8E+05 | 0.708 |
| Vinclozolin | 2.5E+05 | 3.0E+05 | 0.025 | 2.5E+05 | 3.0E+05 | 0.075 |
| Total significant | 21 | 14 | ||||
| Paired test p value | 0.000102 | 0.000349 | ||||
| Kale | Strawberry | |||||
| Without AP | With AP | t-test | Without AP | With AP | t-test | |
| 2-Phenylphenol | 2.0E+06 | 2.6E+06 | 0.077 | 2.2E+06 | 2.4E+06 | 0.549 |
| Acephate | 6.7E+05 | 1.0E+06 | 0.078 | 6.1E+05 | 8.2E+05 | 0.270 |
| Azinphos-methyl | 5.0E+05 | 9.0E+05 | 0.020 | 4.5E+05 | 6.5E+05 | 0.304 |
| BHC, gamma- | 1.1E+06 | 1.4E+06 | 0.202 | 1.2E+06 | 1.3E+06 | 0.679 |
| Bifenthrin | 5.2E+06 | 6.1E+06 | 0.465 | 5.5E+06 | 5.6E+06 | 0.943 |
| Captan | 2.1E+05 | 2.9E+05 | 0.096 | 2.3E+05 | 2.5E+05 | 0.732 |
| Carbaryl | 5.5E+06 | 7.6E+06 | 0.083 | 6.1E+06 | 7.0E+06 | 0.556 |
| Chlorothalonil | 6.5E+05 | 8.7E+05 | 0.097 | 7.4E+05 | 8.3E+05 | 0.571 |
| Chlorpyrifos | 9.5E+05 | 1.1E+06 | 0.284 | 1.0E+06 | 1.1E+06 | 0.787 |
| cis-Permethrin | 7.0E+05 | 9.3E+05 | 0.177 | 7.5E+05 | 8.4E+05 | 0.716 |
| Coumaphos | 2.6E+05 | 3.5E+05 | 0.132 | 2.6E+05 | 2.9E+05 | 0.697 |
| Cyprodinil | 4.8E+05 | 6.0E+05 | 0.191 | 5.6E+05 | 6.1E+05 | 0.696 |
| DDT, p,p'- | 2.9E+06 | 3.7E+06 | 0.238 | 3.1E+06 | 3.3E+06 | 0.771 |
| Deltamethrin | 3.6E+05 | 4.4E+05 | 0.330 | 3.9E+05 | 4.1E+05 | 0.858 |
| Diazinon | 8.7E+05 | 1.0E+06 | 0.228 | 8.8E+05 | 1.0E+06 | 0.415 |
| Dichlofluanid | 1.7E+06 | 2.0E+06 | 0.266 | 1.8E+06 | 2.0E+06 | 0.766 |
| Dichlorvos | 1.8E+05 | 1.8E+05 | 0.944 | 2.1E+05 | 2.0E+05 | 0.952 |
| Dicofol | 1.6E+06 | 2.5E+06 | 0.053 | 1.8E+06 | 2.2E+06 | 0.502 |
| Dimethoate | 5.2E+05 | 6.9E+05 | 0.167 | 5.4E+05 | 6.0E+05 | 0.647 |
| Endosulfan sulfate | 4.3E+05 | 5.4E+05 | 0.204 | 4.3E+05 | 4.5E+05 | 0.888 |
| Endrin | 1.4E+05 | 1.7E+05 | 0.299 | 1.4E+05 | 1.5E+05 | 0.730 |
| Fenhexamid | 4.9E+05 | 6.6E+05 | 0.115 | 4.8E+05 | 5.5E+05 | 0.520 |
| Fenpropathrin | 1.7E+05 | 2.1E+05 | 0.340 | 1.7E+05 | 2.0E+05 | 0.613 |
| Fenthion | 1.6E+06 | 2.1E+06 | 0.178 | 1.8E+06 | 2.0E+06 | 0.631 |
| Folpet | 7.5E+05 | 1.0E+06 | 0.119 | 8.2E+05 | 9.5E+05 | 0.543 |
| Imazalil | 1.2E+05 | 1.7E+05 | 0.066 | 1.1E+05 | 1.4E+05 | 0.472 |
| Iprodione | 9.4E+04 | 1.3E+05 | 0.180 | 1.0E+05 | 1.1E+05 | 0.867 |
| Malathion | 1.4E+06 | 1.8E+06 | 0.213 | 1.5E+06 | 1.8E+06 | 0.478 |
| Metalaxyl | 4.2E+05 | 5.1E+05 | 0.264 | 4.4E+05 | 5.1E+05 | 0.502 |
| Methamidophos | 1.3E+05 | 1.7E+05 | 0.743 | 1.1E+05 | 1.3E+05 | 0.809 |
| Methiocarb | 1.3E+06 | 1.8E+06 | 0.208 | 1.4E+06 | 1.7E+06 | 0.535 |
| Mevinphos | 1.5E+06 | 1.8E+06 | 0.391 | 1.5E+06 | 1.6E+06 | 0.784 |
| Myclobutanil | 6.4E+05 | 8.2E+05 | 0.219 | 6.4E+05 | 7.1E+05 | 0.661 |
| Omethoate | 1.0E+06 | 1.6E+06 | 0.057 | 9.3E+05 | 1.2E+06 | 0.341 |
| Phosalone | 1.1E+05 | 1.5E+05 | 0.106 | 1.1E+05 | 1.2E+05 | 0.601 |
| Pirimiphos methyl | 6.6E+05 | 8.1E+05 | 0.247 | 7.1E+05 | 7.4E+05 | 0.870 |
| Propargite | 1.5E+05 | 2.0E+05 | 0.289 | 1.5E+05 | 1.8E+05 | 0.536 |
| Thiabendazole | 4.9E+06 | 6.6E+06 | 0.087 | 5.9E+06 | 7.3E+06 | 0.287 |
| trans-Permethrin | 7.9E+05 | 9.4E+05 | 0.463 | 8.5E+05 | 9.4E+05 | 0.722 |
| Vinclozolin | 2.4E+05 | 2.9E+05 | 0.212 | 2.6E+05 | 3.1E+05 | 0.432 |
| Total significant | 1 | 0 | ||||
| Paired test p value | 3.02E-05 | 0.000435 | ||||
Conclusions
This evaluation of shikimic acid as an analyte protectant demonstrated that it can provide benefits for some pesticides when using solvent standards for calibration. Matrix-matched calibration provided better overall results, but the use of shikimic acid can improve some chromatographic parameters when matrix-matched calibration is not feasible.
References
- R. Rodríguez-Ramos, S.J. Lehotay, N. Michlig, B. Socas-Rodríguez, M. Rodríguez-Delgado, Critical review and re-assessment of analyte protectants in gas chromatography, J. Chromatogr. A 1632 (2020) 461596. https://www.sciencedirect.com/science/article/pii/S0021967320308700