Method Development Guide for Novel Psychoactive Substances

Introduction
In recent years, toxicology laboratories have been inundated with rapidly emerging novel psychoactive substances (NPS). NPS is an umbrella term that refers to unregulated substances or products that may be designed to mimic the effects of illicit or controlled drugs. They may also be described as “legal highs” since they are unregulated by law. NPS covers a variety of drugs from many different classes, including stimulants, opioids, cannabinoids, hallucinogens, and more. Some of these compounds, despite being called new or novel, are not actually newly synthesized. Many of them were synthesized in the past, explored for potential therapeutic uses, and not approved for one reason or another, but have since reemerged as a drug of abuse.
Despite their legal status, NPS are widely considered to be a public health threat. Use of these compounds has been linked to health issues, including overdose. However, because these compounds emerge so rapidly, information concerning pharmacological effects, dosages, and drug-drug interactions is not available for a large majority of NPS.
The rise of NPS has created a unique challenge for laboratories performing toxicology or seized drug analysis. Being able to detect, identify, and measure these compounds is a necessity that will only continue to grow as more compounds emerge. While this may be a straightforward goal, there are several factors that may complicate this process. The sheer number of NPS presents an obstacle; hundreds, if not thousands, of compounds have been identified. On top of that, new compounds rise and fall in popularity very rapidly, so it can be difficult to know what is currently relevant. Additionally, since many of these compounds are new or were previously unknown as a recreational drug, initial observations of the drugs in samples can be difficult. Typically, a drug is already present in casework samples before lab personnel are even aware of it, meaning testing is almost always a step behind from the start. Developing new assays for NPS compounds can also be time-consuming, difficult, and costly. With all things considered, method development for NPS can seem like a huge undertaking. Understanding the challenges NPS present to the laboratory can be beneficial when tackling method development with these compounds.
In this article, considerations will be outlined, both practical and analytical, when working with NPS. The method development for a subclass of NPS opioids will also be discussed.
Practical and Analytical Considerations of NPS
Chemical Structures
The term NPS covers a vast number of compounds from several different drug classes. This means the chemical structures, and thus chemical properties, of these compounds can differ greatly from one another. On the other hand, drugs within specific subclasses are often chemical analogs of each other and can be very structurally similar.
Fentanyl was originally synthesized in 1960 and was widely used for the medical treatment of pain. It eventually became a popular drug of abuse, resulting in huge numbers of overdose related deaths. Clandestine fentanyl manufacturers began formulating analogs of fentanyl with modified structures to prevent identification as a controlled substance. Acetyl fentanyl is one of these analogs. Where fentanyl has a phenylpropanamide group, acetyl fentanyl has a phenylacetamide group, making them different compounds but extremely structurally similar. This can have implications for analytical techniques, such as LC-MS/MS, which rely on chemical and structural differences to effectively identify and separate compounds.
Being aware of things like isomers and isobars is critical when working on method development for NPS and can help you choose the best analytical conditions for effective analysis. This includes choice of column, mobile phase composition, detectors, temperatures, and other factors.
Prevalence
Between the sheer number of compounds to consider and uncertainty associated with their prevalence in the illicit drug market, trying to decide which NPS are the most relevant to test for can seem like a guessing game. Fortunately, resources are available to help laboratories know which compounds are recommended for testing at any given time. The Center for Forensic Science Research and Education (CFSRE), the Drug Enforcement Administration (DEA), and the National Forensic Laboratory Information System (NFLIS) all provide information regarding new NPS discovery and the frequency at which specific compounds are being detected. Consulting these resources when working on NPS method development can help ensure the most significant compounds are included in the analyte list.
Matrix Considerations
As with all toxicological or drug chemistry analysis, the matrix of the sample should be considered when developing a method for NPS. If toxicology testing is performed on biological fluids, the parent compound, as well as any known metabolites, would likely be included in the list of analytes. Some metabolites remain in the body for longer than the parent drug, even after the parent drug may no longer be detectable. For biological fluid analysis, metabolites are essential for identifying drug use. If the method development was for seized drug identification, metabolites may not hold the same significance they do when working with biological fluids.
An example of this is the designer compound benzodiazepine clonazolam, which is an NPS that first emerged in the illicit drug supply in 2014. A metabolite of clonazolam, 8-aminoclonazolam has been identified. For identifying seized drug evidence, testing for just the parent compound of clonazolam would be appropriate. If toxicological analysis of postmortem blood was being performed, it would be necessary to include both clonazolam and the 8-aminoclonazolam metabolite. It’s important when forming an NPS compound list to consider the matrix and if analysis of metabolites would be relevant.
Development of a Method for Analysis of Nitazenes by LC-MS/MS
Background
Benzimidazole-opioids, more commonly known as nitazenes, are a subclass of synthetic opioids that have emerged on the illicit drug market in recent years. The potency of these compounds can vary, but the pharmacological effects are generally similar to other opioids and can cause respiratory depression. Since the initial reemergence of these compounds, multiple structural analogs have been identified. The general structure of these compounds consists of a benzimidazole ring with an ethylamine at its 1-position and a benzyl group at its 2-position. Nitazene analogs are created by making modifications to this base structure. Figure 1 below depicts some of the currently known nitazene analogs and how they differ structurally. It’s likely we will continue to see new analogs emerge.
Figure 1: Basic Nitazene Structure and Known Structural Analogs [1]
| R1 | R2 | R3 | R4 | ||
| metonitazene | NO2 | OCH3 | CH2CH3 | CH2CH3 | |
| metodesnitazene | H | OCH3 | CH2CH3 | CH2CH3 | |
| etonitazene | NO2 | OCH2CH3 | CH2CH3 | CH2CH3 | |
| etodesnitazene | H | OCH2CH3 | CH2CH3 | CH2CH3 | |
| protonitazene | NO2 | OCH2CH2CH3 | CH2CH3 | CH2CH3 | |
| butonitazene | NO2 | OCH2CH2CH2CH3 | CH2CH3 | CH2CH3 | |
| isotonitazene | NO2 | OCH(CH3)2 | CH2CH3 | CH2CH3 | |
| clonitazene | NO2 | CI | CH2CH3 | CH2CH3 | |
| flunitazene | NO2 | F | CH2CH3 | CH2CH3 | |
| etonitazepyne | NO2 | OCH2CH3 | -CH2CH2CH2CH2- | ||
| etonitazepipne | NO2 | OCH2CH3 | -CH2CH2CH2CH2CH2- | ||
Drugs of this structural class were first synthesized in the 1950s to research their analgesic properties but were not approved for human use [1]. Some of these compounds have popped up on the illicit drug market in the decades since, with isotonitazene appearing in early 2019 within the United States [2].
In 2020, the DEA announced they were planning to place isotonitazene under Schedule I of the Controlled Substances Act in an attempt to reduce the number of related overdose deaths [2]. Despite this effort, new nitazene analogs have continued to infiltrate the illicit drug market in the last few years. Until recently, most of the analogs being identified were included in the original patent literature. The emergence of nitazene analogs, such as N-Pyrrolidino etonitazene, marks a new era for this subclass, as they were not included in the early literature and are truly newly synthesized novel psychoactive substances [2]. This indicates this class of drugs is not going away anytime soon but will continue to evolve and increase in popularity. These compounds demonstrate how a previously synthesized drug may reemerge as an NPS and evolve into structurally similar analogs.
Figure 2: Timeline of nitazene emergence.
It’s highly recommended that labs performing toxicology or drug chemistry analysis add nitazenes to their testing scopes. In the remainder of this article, we will discuss the method development process for a panel of nitazene compounds.
Forming Analyte List
While there are a considerable number of nitazene analogs, not all of them are currently prevalent in the illicit drug market. One approach could be to develop a method for all nitazene compounds currently known, but this would result in a longer method as well as more money spent on reference materials for compounds that are unlikely to be identified in casework. A more efficient option is to consult the resources mentioned earlier in this article to learn which nitazene compounds are currently most prevalent. At the time of this article, the following nitazenes were identified as scope recommendations: N-Desethyl isotonitazene, isotonitazene, N-Pyrrolidino etonitazene, N-Pyrrolidino protonitazene, N-Pyrrolidino metonitazene, protonitazene, and iso-butonitazene [3].
The developed method’s intended use is for the toxicological analysis of urine samples. A universal metabolite of several nitazene drugs, 4′-hydroxy Nitazene, has been detected in multiple body fluids, including blood and urine [2]. Detection of this metabolite is indicative of nitazene usage. It was also added to the analyte list.
Figure 3: List of nitazenes for method development.
| Isotonitazene (410.5 g/mol) |
Protonitazene (410.5 g/mol) |
iso-Butonitazene (424.5 g/mol) |
N-Desethyl-isotonitazene (382.5 g/mol) |
| N-Pyrrolidino etonitazepyne (394.5 g/mol) |
N-Pyrrolidino metonitazene (380.4 g/mol) |
N-Pyrrolidino protonitazene (408.5 g/mol) |
4′-hydroxy Nitazene (368.4 g/mol) |
HPLC Column and Mobile Phase Choice
With so many HPLC columns to choose from, choosing which one to develop a new method on can be overwhelming. C18 and Biphenyl are by far the most popular stationary phase choices for most drug testing laboratories and may be seen as “go-to” phases for these sorts of applications. Many drugs of abuse may be effectively analyzed on both C18 and Biphenyl phase columns, but they bring different advantages to the table.
When choosing a stationary phase, consider the structures and chemical properties of the compounds of interest. If the analyte list includes any isomers, choosing the right column can mean the difference between adequately resolving the pair and having them coelute with one another. In the case of the nitazenes chosen for method development, all eight compounds are very structurally similar and contain a pair of isomers. Isotonitazene and protonitazene are isomers of each other, differing structurally only in the substitution at the para position of the benzyl moiety. With how similar the analytes of interest are, choosing a column that will be able to give sufficient resolution is critical.
The Raptor Biphenyl column is an ideal choice for hard-to-separate-compounds like these. This column utilizes core-shell particle technology for high efficiency and offers increased selectivity for tough separations due to its enhanced pi-pi interactions. A Raptor Biphenyl 50 x 2.1 mm, 2.7 µm column (cat.# 9309A52) was chosen for the development of this method. To protect the column from any particulates or contamination from the urine matrix, a Raptor Biphenyl EXP guard column cartridge 5 x 2.1 mm, 2.7 µm (cat.# 9309A0252) was used.
Methanol and acetonitrile are both commonly used as organic phases in HPLC and were both considered for this method. As mentioned above, pi-pi interactions contribute to the improved separation achieved by the biphenyl stationary phase. The structure of methanol has no pi electrons, so when it’s used as an organic mobile phase with a biphenyl stationary phase column, it permits the pi-pi interactions of the stationary phase to occur, thus enhancing separation. Conversely, the structure of acetonitrile contains a bond that has pi electrons and can diminish the pi-pi interactions of the biphenyl phase. For this reason, the solvent selected for mobile phase A was water, and the solvent selected for mobile phase B was methanol, both acidified with 0.1% formic acid.
Method Development and Optimization
MRM transitions for each analyte were optimized on a Shimadzu 8045 LC-MS/MS. The details of the transitions are depicted in the table below.
Table I: MRM Transitions for Nitazene Compounds
| Peak | Ion Mode | Precursor | Product Ion | Product Ion |
| 4′-hydroxy Nitazene | ESI+ | 369.1 | 100.2 | 72.3 |
| iso-Butonitazene | 425.2 | 100.3 | 72.2 | |
| Isotonitazene | 411.0 | 100.2 | 72.2 | |
| N-Desethyl isotonitazene | 383.0 | 72.3 | 312.2 | |
| N-Pyrrolidino etonitazene | 395.0 | 98.3 | 56.1 | |
| N-Pyrrolidino metonitazene | 381.0 | 98.2 | 121.2 | |
| N-Pyrrolidino protonitazene | 409.0 | 98.3 | 56.2 | |
| Protonitazene | 411.0 | 100.2 | 72.2 |
An LC-MS/MS method was developed using the described column, mobile phases, and MRM transitions. The elution gradient, flow rate, and column temperature were optimized to attain the best possible separation of the analytes. Once the method was optimized, the analytes were spiked into blank urine to ensure no matrix interferences were present.
Final Method
The final method parameters, a representative chromatogram, and analyte retention times are presented below.
Table II: Nitazenes LC-MS/MS Method Parameters
| Column: | Raptor Biphenyl 50 x 2.1 mm, 2.7 µm (cat.# 9309A52) | |||||||||||||||||||||
| Guard: | Raptor Biphenyl EXP guard column cartridge 5 x 2.1 mm, 2.7 µm (cat.# 9309A0252) | |||||||||||||||||||||
| Mobile Phase A: | 0.1% formic acid in water | |||||||||||||||||||||
| Mobile Phase B: | 0.1% formic acid in methanol | |||||||||||||||||||||
| Flow: | 1.0 mL/min | |||||||||||||||||||||
| Gradient: |
|
|||||||||||||||||||||
| Column Temperature: | 40 °C | |||||||||||||||||||||
| Injection Volume: | 10 µL | |||||||||||||||||||||
| Diluent: | 0.1% formic acid in water (MPA) |
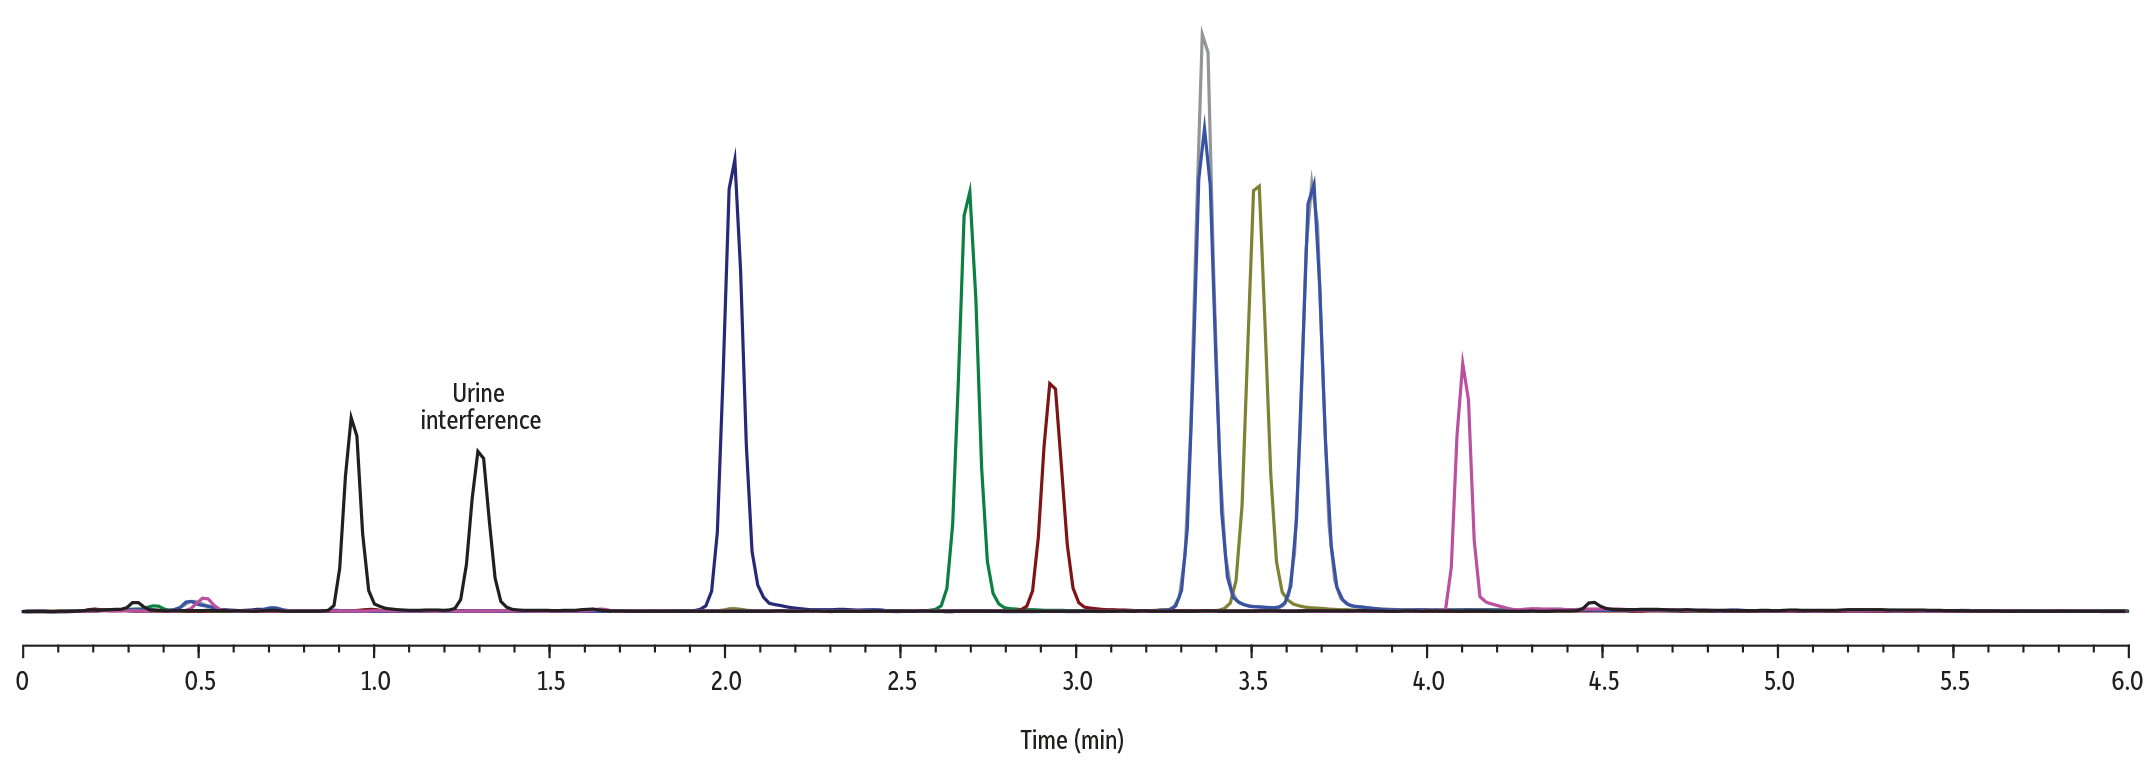
Table III: Analyte Retention Times
| Analyte # | Analyte | Retention Time (min) |
| 1 | 4′-hydroxy Nitazene | 0.94 |
| 2 | N-Pyrrolidino metonitazene | 2.03 |
| 3 | N-Pyrrolidino etonitazene | 2.69 |
| 4 | N-Desethyl isotonitazene | 2.94 |
| 5 | Isotonitazene | 3.36 |
| 6 | N-Pyrrolidino protonitazene | 3.53 |
| 7 | Protonitazene | 3.67 |
| 8 | iso-Butonitazene | 4.12 |
The final method had a total run time of six minutes. This method successfully separated all eight nitazene compounds, including the pair of isomers. A urine interference was identified but is well resolved from all the analytes of interest. All analytes elute within five minutes, with an additional one-minute re-equilibration column period at the end.
The developed method is quick and effective, allowing for the analysis of eight nitazene compounds in six minutes. All analytes, including a critical pair, are adequately resolved. This method would be well suited for toxicological or drug chemistry analysis of samples containing nitazene compounds.
Streamline NPS Method Development with Pro EZLC Chromatogram Modeler
Method development can be time-consuming, costly, and occupy resources like instrument time and labor. Combined with the urgency and uncertainty surrounding NPS compounds, method development can be especially burdensome. Pro EZLC is a virtual liquid chromatography modeler that can be used to develop and optimize LC methods without spending hands-on time in the lab. Pro EZLC software can be used to compare stationary phases, column dimensions, mobile phases, and other parameters affecting separation [4]. The “Drugs of Abuse” compound library contains an up-to-date list of NPS, including the nitazene compounds discussed above.
While some difference in retention time is expected between instruments, Pro EZLC software predicts retention times with accuracy. To demonstrate the closeness of the predicted and observed values, the developed nitazene method was modeled, and the observed and expected retention times were compared. The chromatogram and predicted retention times generated by the software are shown below (Figure 5).
Figure 5: Simulated Chromatogram for Nitazenes Method Generated by Pro EZLC Software
Table IV: Predicted Retention Times and Peak Labels for Nitazenes Method
| Analyte | tR (min) | RS | Peak Width (min) | Exit %B | Mode | Precursor Ion | Quantifier Product Ion | |
| 1 | 4′-hydroxy Nitazene | 0.90 | 0.064 | 30.5 | + | 369.1 | 100.2 | |
| 2 | N-Pyrrolidino metonitazene | 2.14 | 0.076 | 38.2 | + | 381.0 | 98.2 | |
| 3 | N-Pyrrolidino etonitazene | 2.81 | 0.077 | 42.4 | + | 395.0 | 98.3 | |
| 4 | N-Desethyl isotonitazene | 3.09 | 0.076 | 44.1 | + | 383.0 | 72.3 | |
| 5 | Isotonitazene | 3.58 | 4.7 | 0.074 | 47.2 | + | 411.0 | 100.2 |
| 6 | N-Pyrrolidino protonitazene | 3.70 | 0.075 | 48.0 | + | 409.0 | 98.3 | |
| 7 | Protonitazene | 3.92 | 0.072 | 49.3 | + | 411.1 | 100.3 | |
| 8 | iso-Butonitazene | 4.23 | 0.036 | 62.4 | + | 425.2 | 100.3 |
Table V: Comparison of Pro EZLC Software Predicted (Expected) and Observed Retention Times
| Peak # | Analyte | Expected tR (min) | Observed tR (min) | Difference (sec) | % Difference |
| 1 | 4′-hydroxy Nitazene | 0.90 | 0.94 | 2.4 | 4.44% |
| 2 | N-Pyrrolidino metonitazene | 2.14 | 2.03 | 6.6 | 5.14% |
| 3 | N-Pyrrolidino etonitazene | 2.81 | 2.69 | 7.2 | 4.27% |
| 4 | N-Desethyl isotonitazene | 3.09 | 2.94 | 9.0 | 4.85% |
| 5 | Isotonitazene | 3.58 | 3.36 | 13.2 | 6.14% |
| 6 | N-Pyrrolidino protonitazene | 3.70 | 3.53 | 10.2 | 4.59% |
| 7 | Protonitazene | 3.92 | 3.67 | 15.0 | 6.37% |
| 8 | iso-Butonitazene | 4.23 | 4.12 | 6.6 | 2.60% |
When compared, the chromatogram generated by Pro EZLC software and experimental data lineup closely. The difference of retention time is 15 seconds or less for all analytes, with an average percent difference of 4.80%. Elution order and resolution, including separation of isomers, is consistent between the modeler and instrument. The Pro EZLC chromatogram modeler is a valuable tool that can both speed up and simplify NPS method development.
References
- Drug Enforcement Administration, Drug & Chemical Evaluation Section, Benzimidazole-opioids, (November 2022) https://www.deadiversion.usdoj.gov/drug_chem_info/benzimidazole-opioids.pdf
- S. Walton, et al., A forward-thinking approach to addressing the new synthetic opioid 2-benzylbenzimidazole nitazene analogs by liquid chromatography–tandem quadrupole mass spectrometry (LC–QQQ-MS), J. Toxicol. 46 (3), Oxford UP (2021) 221–31. https://doi.org/10.1093/jat/bkab117.
- Center of Forensic Science Research & Education, Recommended scope for NPS testing in the United States: Q2 2022 (2022) https://www.cfsre.org/images/scoperecommendations/Q2-2022-NPS-Scope-Recommendations-NPS-Discovery-072522.pdf.
- Restek Corporation, Pro EZLC software simplifies LC method development, Video, https://www.restek.com/videos/pro-ezlc-software-simplifies-lc-method-development.