Quantitative LC-UV Method for CBD in Topicals with Simplified Extraction of Lotions, Balms, and Creams

Abstract
A universal extraction method has been developed for the LC-UV analysis of cannabidiol (CBD) in infused lotions, balms, and creams. The method was evaluated using fortified samples with percent recoveries ranging from 90.2–108%. Linearity was evaluated from 2–300 ppm and returned an R2 value of 0.9997. The sample preparation methods developed here produce clean extracts and reliable results. The LC-UV analysis was conducted using a Raptor ARC-18 (150 mm x 4.6 mm ID x 2.7 µm) column with a Raptor ARC-18 EXP guard column cartridge. Isocratic mobile phase conditions were used for a total run time of five minutes per sample.
Introduction
Cannabidiol is a nonpsychoactive cannabinoid found in cannabis plants and cannabis-related products. Currently, CBD is not an FDA scheduled drug in the United States, and it is sold in a number of different topical products, including lotions, balms, and creams. Developing extraction and analytical methods for these matrices can be very difficult because they are composed of a diverse array of ingredients, which makes it challenging to develop universal procedures that work for all samples. In the LC-UV method for CBD in topicals developed here, one sample preparation and method of analysis was successfully used to quantify CBD in all three sample types. The product of this sample preparation method is a clean extract that will ensure instrument uptime and maximize column lifetime while providing fast and reliable quantitation of CBD in these complex matrix samples.
Experimental
A lotion blank and CBD-containing lotion, balm, or cream samples were weighed (0.5 grams) into a 50 mL centrifuge tube (cat.# 25846). The sample was distributed in as thin a layer as possible inside the centrifuge tube to avoid forming large flocculation particles upon the addition of solvent. Solvent was added to the centrifuge tube (5 mL of 50:50 methyl tert-butyl ether:methanol) and vortexed for ~90 seconds. To help facilitate the extraction of CBD, samples were put on a shaker table for 5 minutes. Centrifugation was then performed for 5 minutes at 3000 rpm at 4 °C. The supernatant was transferred (50 µL) to a vial, and the solvent was dried down with a stream of nitrogen. Each sample was reconstituted with 25:75 water:acetonitrile (1 mL) and vortexed. A 300 µL aliquot was transferred to a 0.2 µm PTFE Thompson filter vial (cat.# 28307) and filtered prior to LC-UV analysis.
All samples were analyzed in triplicate by LC-UV at a wavelength of 228 nm. The oven was set to 30 °C and equipped with a Raptor ARC-18 150 mm x 4.6 mm ID x 2.7 µm column (cat.# 9314A65) paired with a Raptor ARC-18 5 x 4.6 mm ID x 2.7 µm EXP guard column (cat.# 9314A0250). The flow rate was set to 1.5 mL/min, and 5 µL of sample was injected. Mobile phase A consisted of 5 mM ammonium formate with 0.1% formic acid in water, and mobile phase B consisted of 0.1% formic acid in acetonitrile. The samples were analyzed under isocratic conditions at 75% B.
To evaluate this LC-UV method for CBD in topicals, recovery experiments were prepared in triplicate and performed by fortifying CBD (cat.# 34011) into samples to achieve a final concentration of 6 ppm. Calibration standards were prepared at 2, 3, 5, 10, 20, 50, 100, 200, and 300 ppm and analyzed in triplicate. Quality control standards were prepared at 8, 80, and 280 ppm and analyzed six times each.
A comparison of label claims to experimental values was made by calculating the native concentrations of CBD in lotion, balm, and cream containers based on the measured concentrations in each sample. This value was compared to the advertised amount of CBD by calculating percent difference (Equation 1). Percent recovery experiments were performed by fortifying a set of samples prior to sample preparation and another set of samples post-sample preparation at a concentration of 6 ppm. These values were then used to calculate percent recovery to determine if any analyte was lost during the sample preparation procedure (Equation 2).
| Equation 1: | |
| Equation 2: |
Results and Discussion
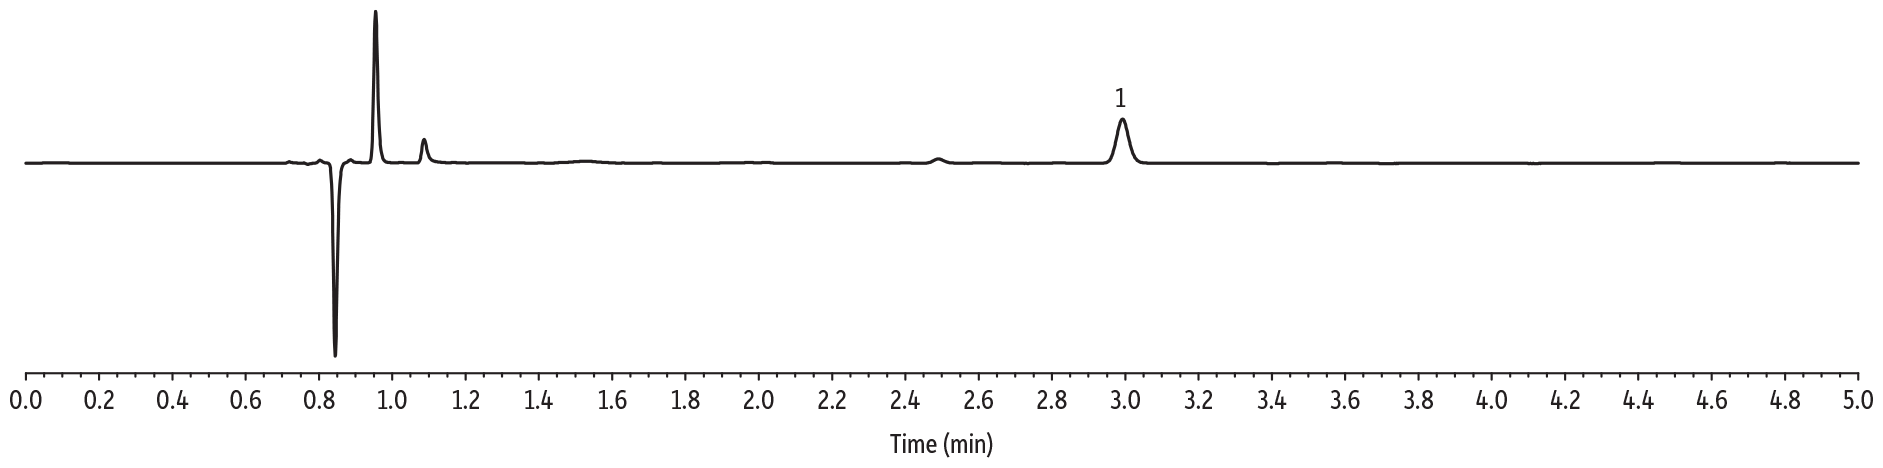
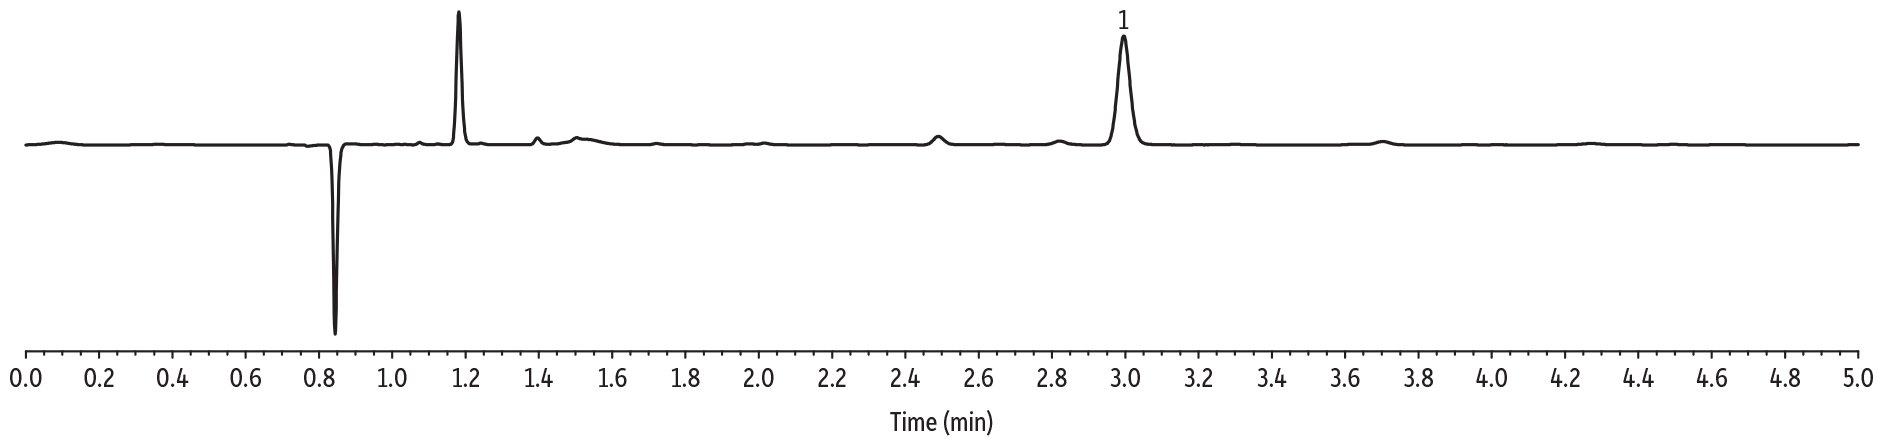
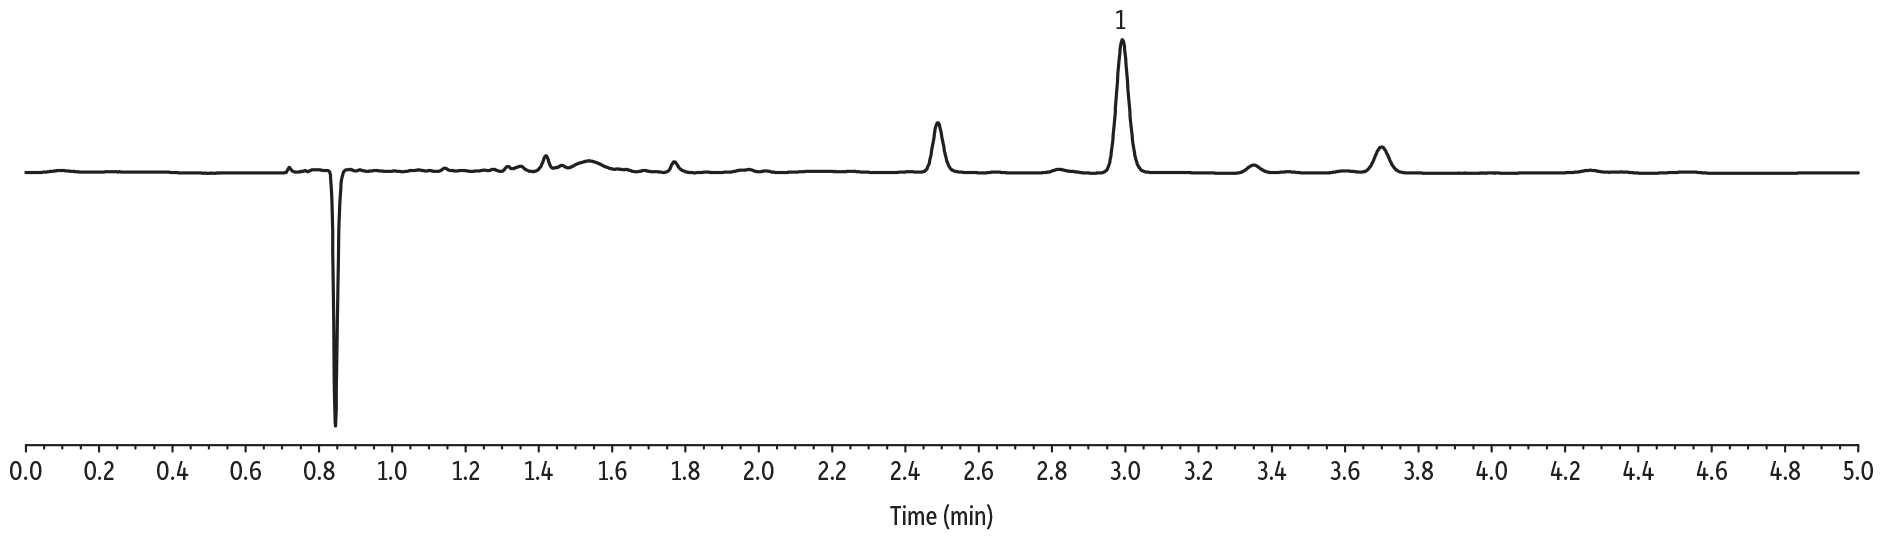
Initial solubility experiments were performed to determine which extraction solvent could best dissolve the majority of samples. Ultimately, the extraction solvent chosen was not able to fully dissolve most samples but was able to quantitatively extract CBD from the matrix. The LC-UV method for CBD in topicals developed here allows for multiple CBD-infused samples (lotions, balms, creams) to be analyzed by the same sample preparation procedure and method of analysis, saving time and allowing for higher throughput. The LOD for these experiments was determined to be 2 ppm. Experimentally determined CBD per bottle, precision (%RSD), percent difference, and percent recovery are displayed in Tables I and II, respectively. A typical calibration curve is presented in Figure 1 and representative chromatograms for each sample matrix are shown in Figure 2.
Table I: Advertised label value of CBD, experimentally calculated concentration of CBD, calculated precision, and percent difference (using Equation 1) compiled for each sample.
| Sample | CBD Label Value per Bottle (mg) |
Experimental CBD per Bottle (mg) |
Precision (%RSD) |
% Difference (Experimental vs. Label) |
|---|---|---|---|---|
| 1. Hemp-infused lotion | 348 | 343 | 0.84 | 1.42 |
| 2. CBD-infused lotion | 600 | 617 | 1.43 | 2.90 |
| 3. CBD-infused cream | 150 | 151 | 3.08 | 0.69 |
| 4. CBD-infused balm | 100 | 88.6 | 2.94 | 11.4 |
| 5. Hemp-infused balm | 82.6 | 82.3 | 2.96 | 0.39 |
| 6. CBD-infused lotion | 250 | 269 | 2.02 | 7.58 |
| 7. CBD-infused cream | 100 | 90.5 | 9.51 | 9.55 |
| 8. CBD-infused lotion | 100 | 97.1 | 5.02 | 2.91 |
| 9. CBD- infused balm | 70.0 | 55.8 | 4.46 | 20.3 |
Table II: Percent recovery values of fortified samples calculated by using Equation 2.
| Sample | % Recovery |
|---|---|
| 1. Hemp-infused lotion | 106 |
| 2. CBD-infused lotion | 108 |
| 3. CBD-infused cream | 96.8 |
| 4. CBD-infused balm | 90.2 |
| 5. Hemp-infused balm | 99.2 |
| 6. CBD-infused lotion | 102 |
| 7. CBD-infused cream | 98.8 |
| 8. CBD-infused lotion | 99.0 |
| 9. CBD-infused balm | 90.7 |
| 10. Blank lotion (no CBD) | 101 |
Figure 1: Calibration Curve
Figure 2: Example chromatograms for this LC-UV method for CBD in topicals.
Conclusion
The LC-UV method for CBD in topicals that is presented here allows for a fast and straightforward sample preparation and subsequent detection of CBD in lotions, balms, and creams. The total run time for the analysis is five minutes per sample. The applicability of this methodology for multiple sample types provides labs with an opportunity for higher sample throughput by applying a single method to a wide variety of CBD-infused lotions, balms, and creams.