Will Pro EZGC Chromatography Modeling Software Work For You? We Put It to the Test!

Method development is hard. As any analyst will tell you, it takes time—and a lot of trial and error—even for the most experienced chromatographer. Wouldn’t it be convenient if there were a tool that allowed you to develop optimized GC methods in just a matter of seconds? Restek’s Pro EZGC chromatogram modeling software is just such a tool! It provides GC column recommendations as well as the tailored set of conditions you need without the hours of experimentation, saving you time, material costs, and lots of frustration.
To demonstrate the power of the Pro EZGC chromatogram simulator, we used a few examples of analyses conducted in our labs to test the accuracy of the GC modeling software’s predictions. Using the same analytical run conditions as in the empirical work, will the modeler produce a simulated chromatogram that matches real-world results? Our examples span a variety of chemical classes and column phases to demonstrate how the Pro EZGC modeling software is valid for a wide range of applications.
While these examples pit the performance of the Pro EZGC chromatogram simulator against experimentally established instrumental conditions with the goal of showing just how closely the modeled results match the data generated empirically, the real power of the Pro EZGC modeler is its ability to provide optimized analytical conditions using only a list of compounds. The demonstration presented here illustrates the accuracy of the underlying principles that power the modeler, so that when using the Pro EZGC chromatogram simulator to create your next method from scratch, you will have confidence its predictions will be remarkably close to the actual chromatography you'll obtain when you try it out on your GC.
Before we get started, there are a few things to keep in mind when comparing empirical results to modeled chromatograms. First, any differences in peak heights are due to the model’s random generation of height; without information regarding compound concentrations and detector sensitivities, it is impossible to accurately predict the relative peak heights for the compounds modeled. Second, the software ideally predicts resolutions (R) of 1.5 or higher because an R of 1.5 means two peaks have been baseline resolved. In instances where it isn’t possible to have baseline resolution, the model highlights those resolution values in either yellow or red in the peak table list, depending on how far the predicted value is from an ideal R of 1.5. Figure 1 illustrates the typical output that is provided by the modeling software.
Figure 1: Just input your analyte list, and the Pro EZGC chromatogram simulator delivers a customized, interactive model chromatogram that provides a specific phase, column dimension, and conditions. You can change columns, modify conditions, zoom in, view chemical structures, and even overlay mass spectra of coeluting compounds.
Example 1: Ensure the Separation of Critical Compounds with Pro EZGC Simulations
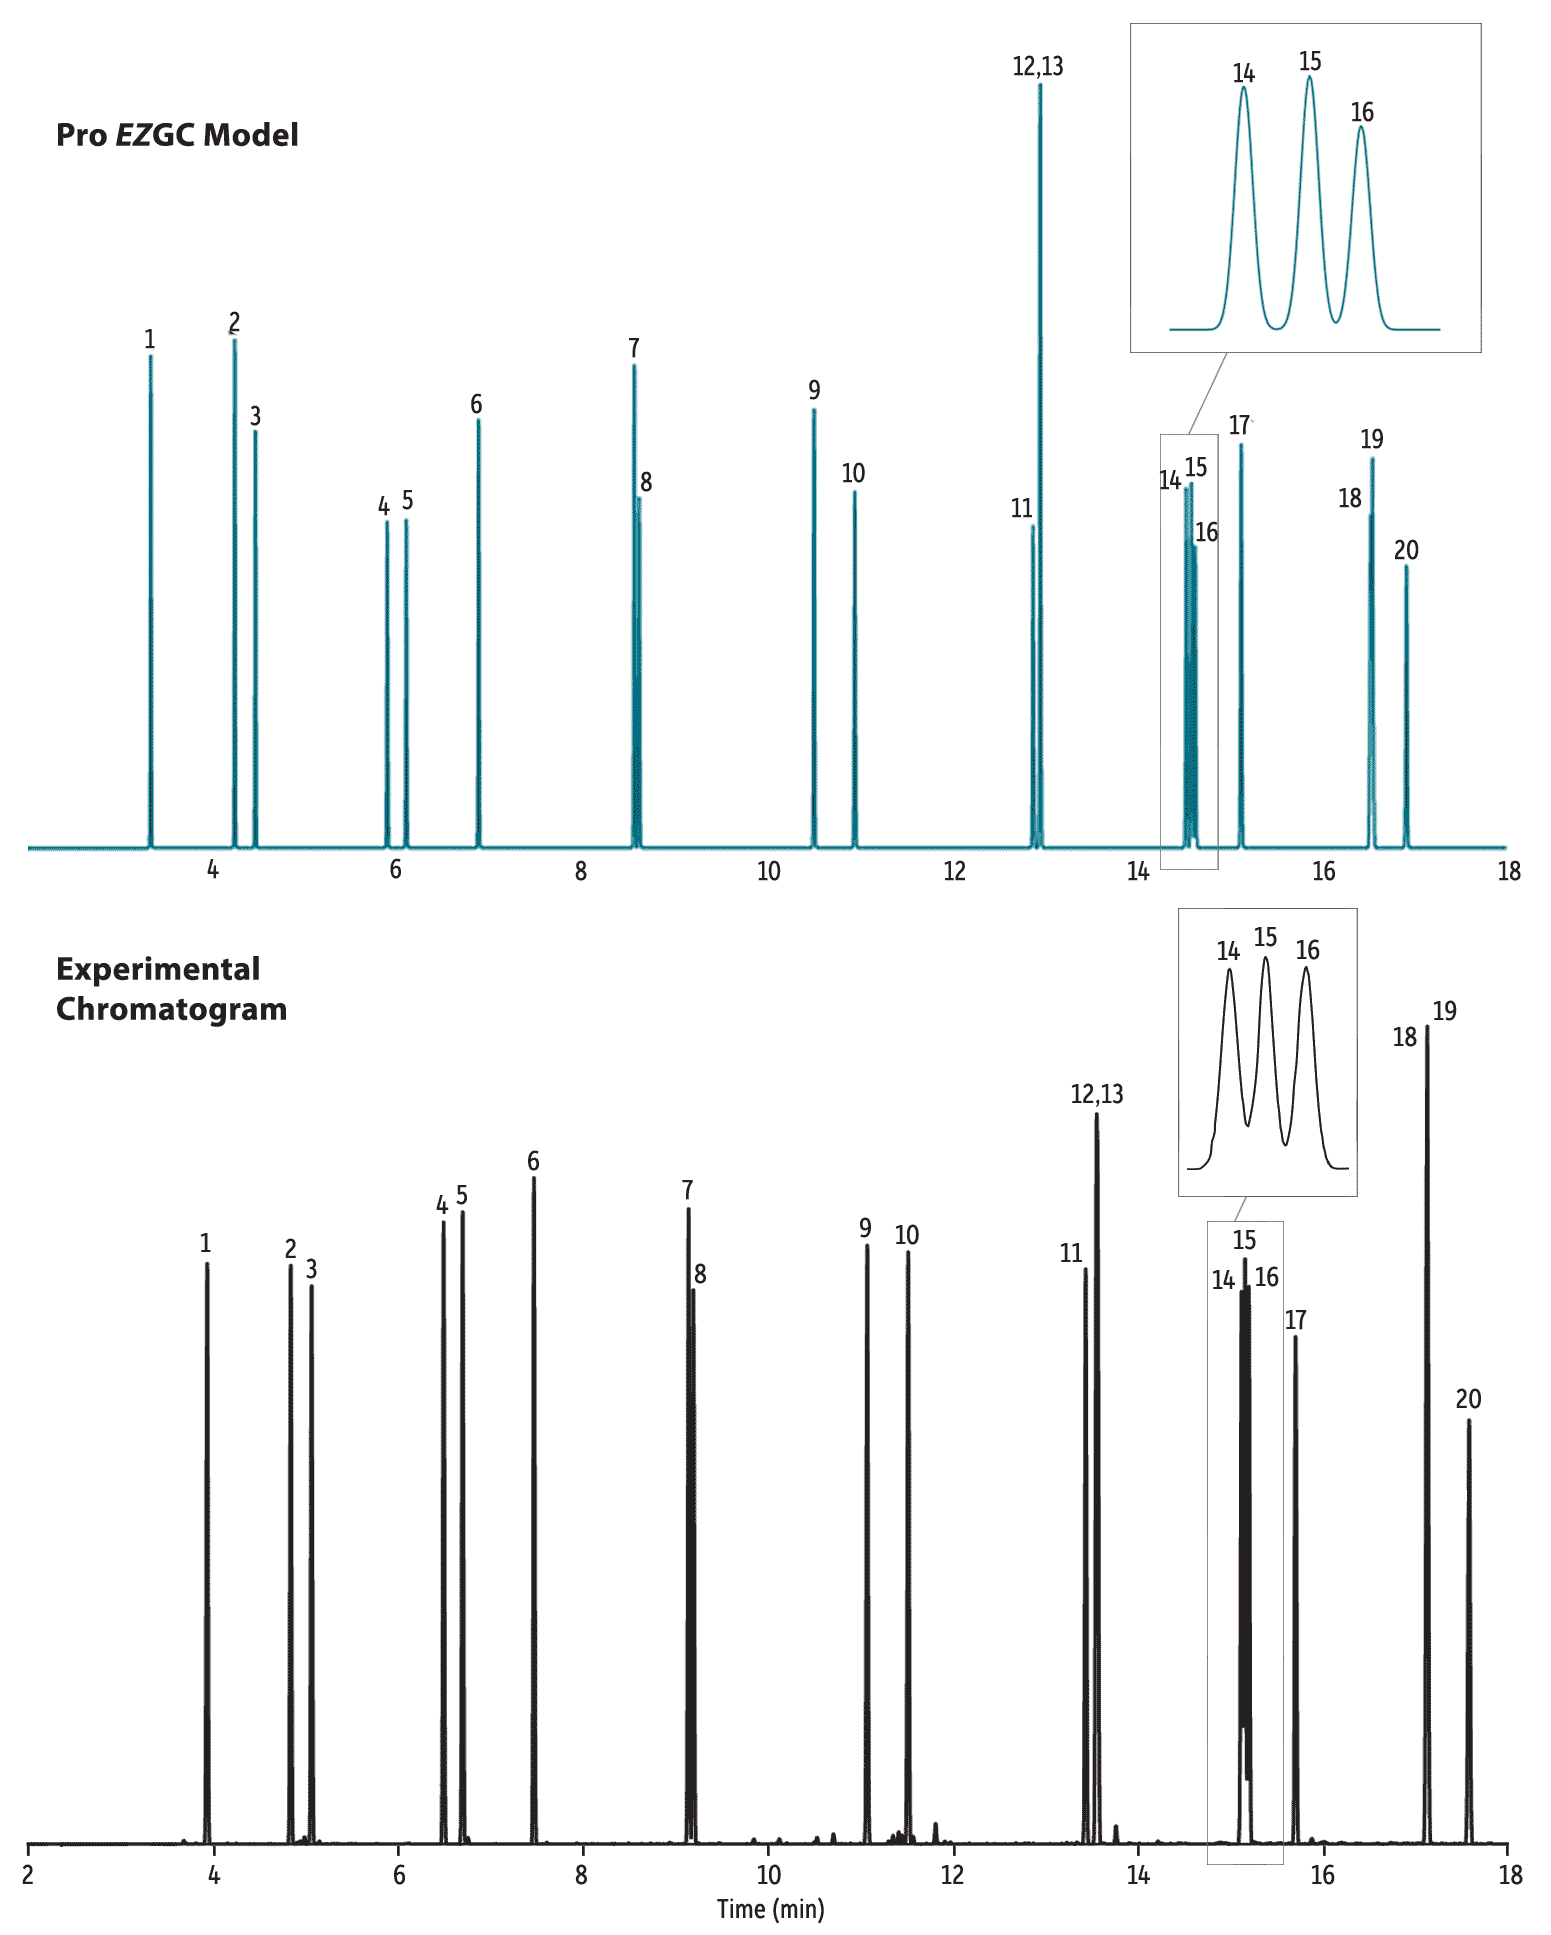
Some compounds are difficult to separate because they are very similar, yet their chromatographic resolution may be required. For example, the isomers benzo[b]fluoranthene, benzo[k]fluoranthene, and benzo[j]fluoranthene coelute on many stationary phases, but they must be resolved chromatographically for accurate reporting because the mass spectrometer can’t distinguish them spectrally. In Figure 2, you can see that the modeled results closely match the empirical results in terms of relative peak resolution. Actual retention times may shift slightly due to differences in the temperature calibration between the experimental instrument and the one used to develop the modeler’s compound libraries; however, even with small retention time shifts, the Pro EZGC chromatogram modeler accurately predicted this critical resolution under the same conditions. Imagine the method development time that could be saved by using GC modeling software to establish conditions that ensure key separations instead of spending time testing conditions in the lab!
Figure 2: The Pro EZGC chromatogram simulator correctly models critical separations.
| Peaks | |
|---|---|
| 1. | Naphthalene |
| 2. | 2-Methylnaphthalene |
| 3. | 1-Methylnaphthalene |
| 4. | Acenaphthylene |
| 5. | Acenaphthene |
| 6. | Fluorene |
| 7. | Phenanthrene |
| 8. | Anthracene |
| 9. | Fluoranthene |
| 10. | Pyrene |
| Peaks | |
|---|---|
| 11. | Benzo[a]anthracene |
| 12. | Chrysene |
| 13. | Triphenylene |
| 14. | Benzo[b]fluoranthene |
| 15. | Benzo[k]fluoranthene |
| 16. | Benzo[j]fluoranthene |
| 17. | Benzo[a]pyrene |
| 18. | Indeno[1,2,3-cd]pyrene |
| 19. | Dibenz[a,h]anthracene |
| 20. | Benzo[ghi]perylene |
| Column | Rxi-17Sil MS, 15 m, 0.25 mm ID, 0.25 µm (cat.# 14120) |
|---|---|
| Standard/Sample | |
| Diluent: | Methylene chloride |
| Conc.: | 20 ng/µL |
| Injection | |
| Inj. Vol.: | 1 µL split (split ratio 20:1) |
| Liner: | 4 mm split Precision liner w/wool |
| Inj. Temp.: | 275 °C |
| Split Vent Flow Rate: | 42 mL/min. |
| Oven | |
| Oven Temp.: | 80 °C (hold 1 min) to 320 °C at 15 °C/min (hold 2 min) |
| Carrier Gas | H2, constant flow |
| Flow Rate: | 2 mL/min |
| Detector | FID @ 340 °C |
|---|---|
| Constant Column + Constant Make-up: | 50 mL/min |
| Make-up Gas Type: | N2 |
| Data Rate: | 20 Hz |
| Instrument | Agilent/HP6890 GC |
| Notes | Liner cat.# 21022 was used to produce this chromatogram, but has since been discontinued. For assistance choosing a replacement for this application, contact Restek Technical Service or your local Restek representative. |
Example 2: Determine if QC Requirements Can Be Met
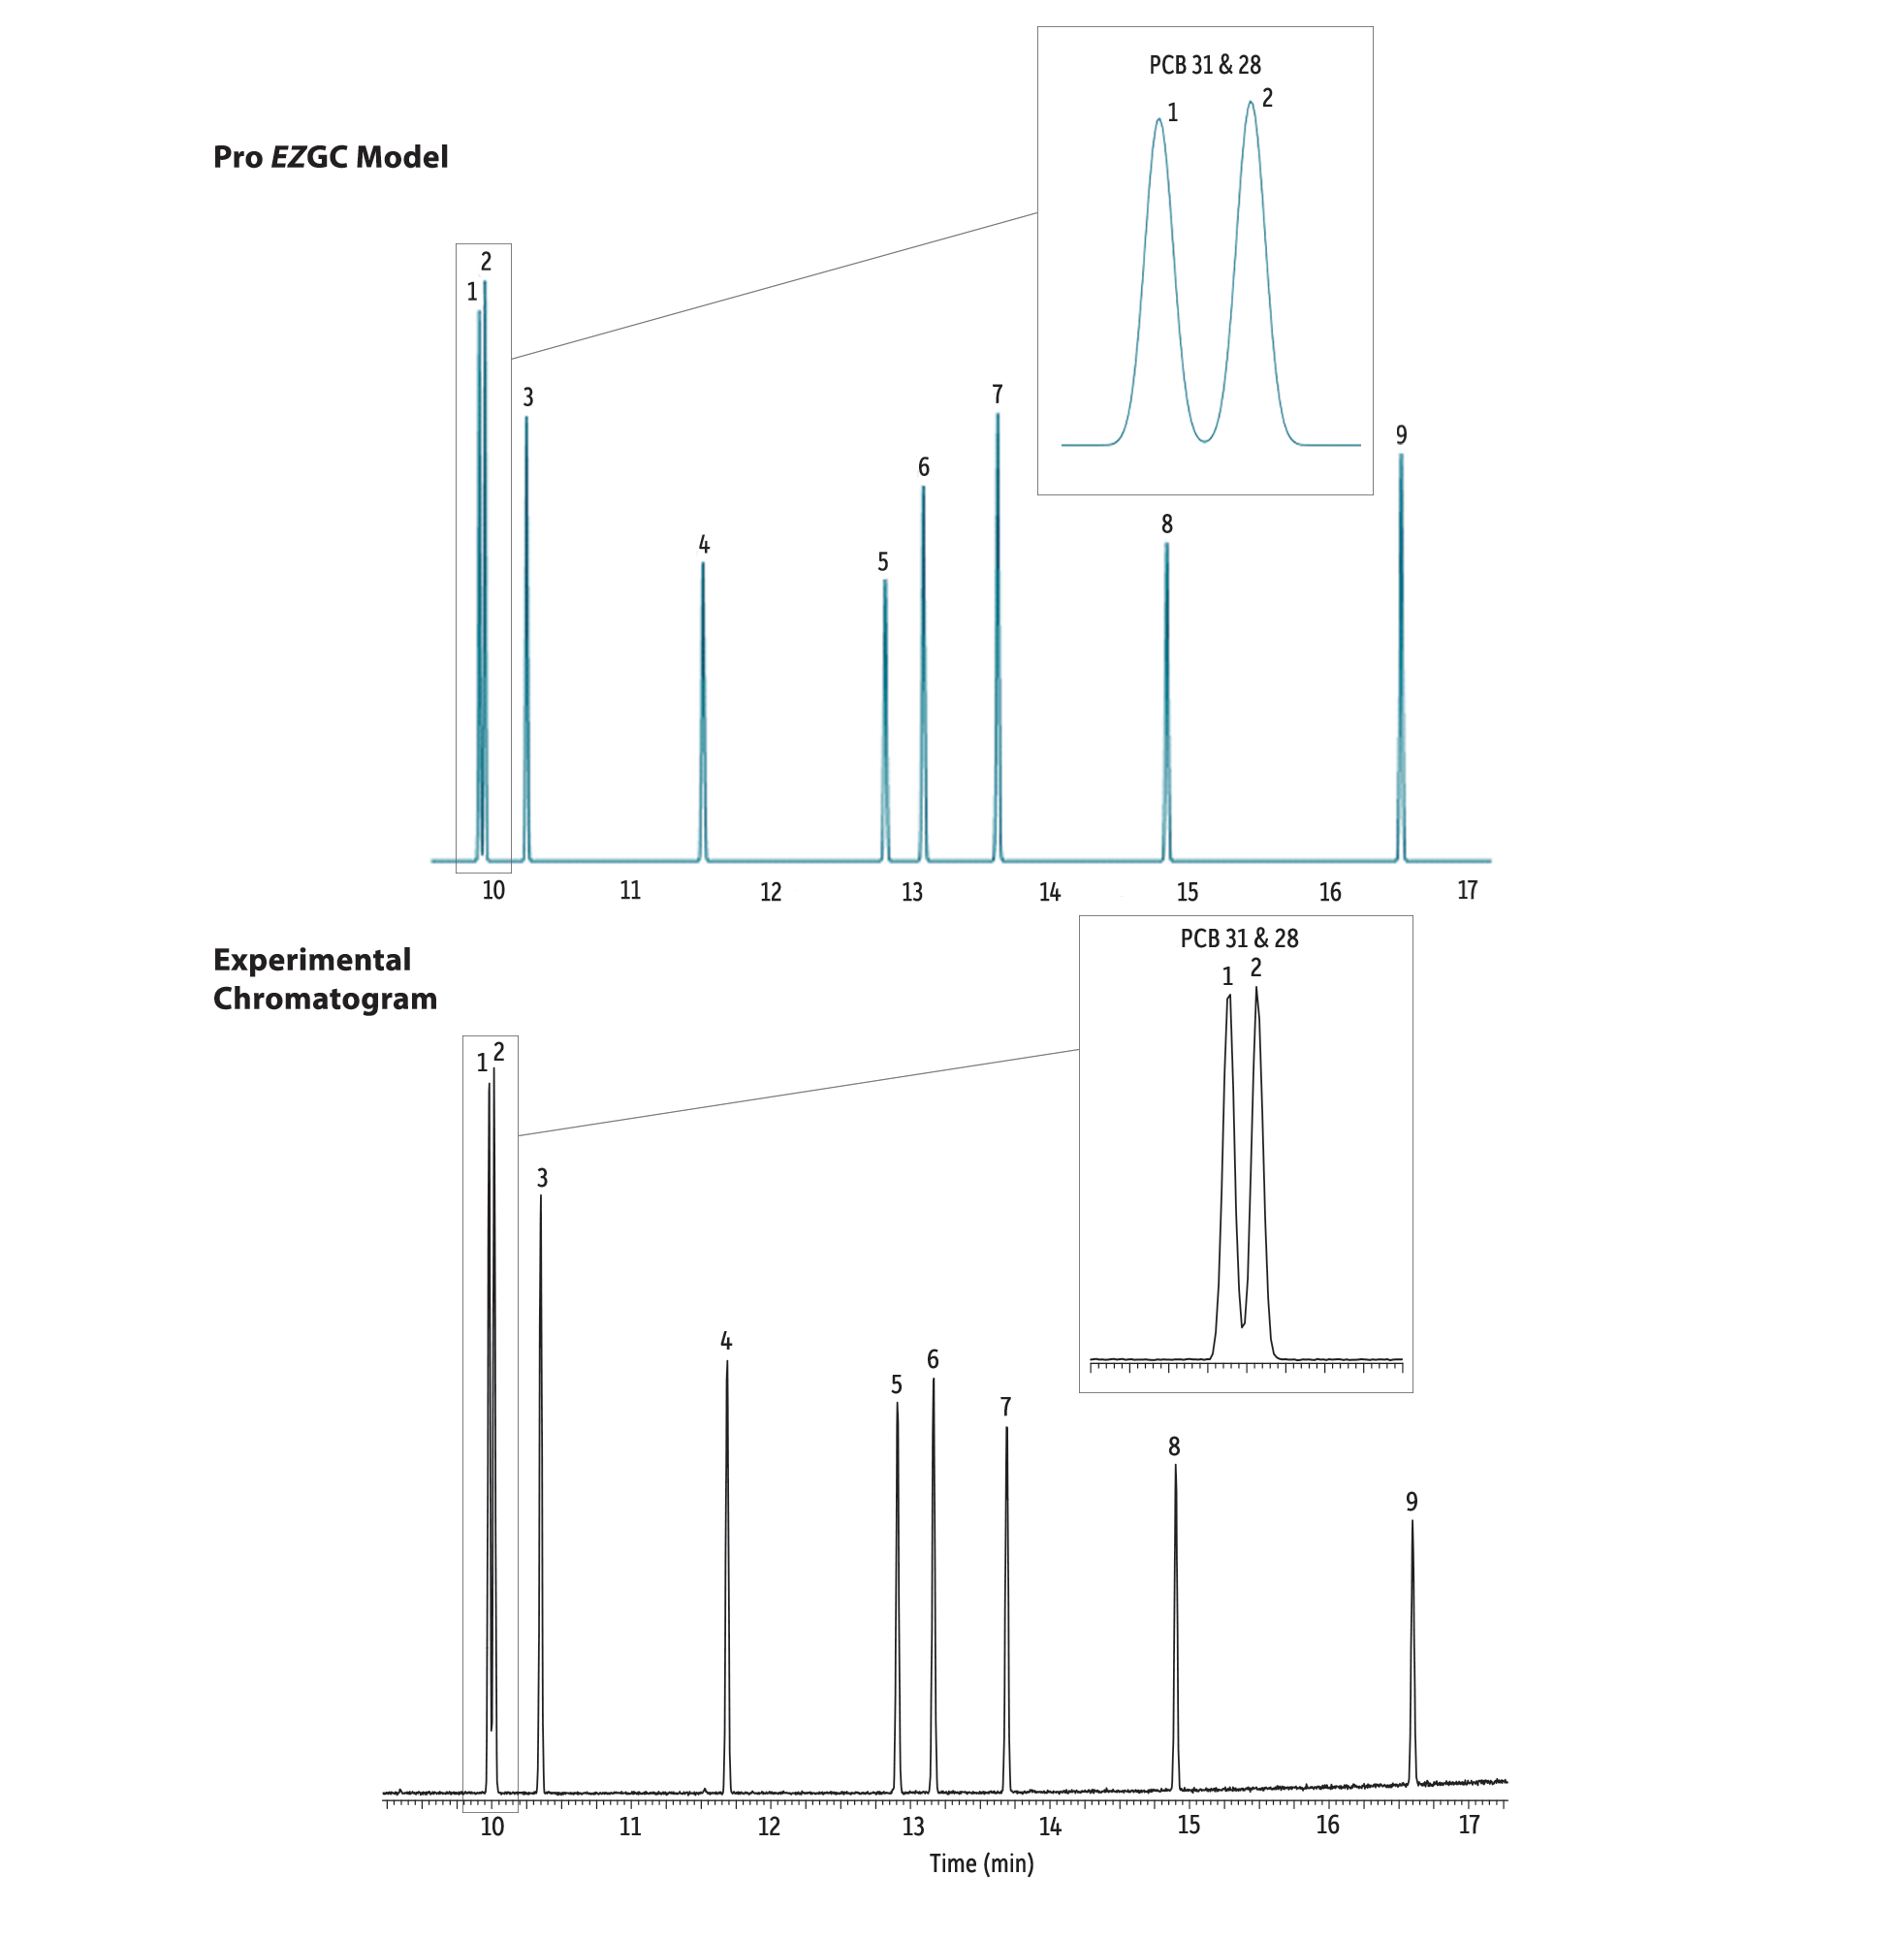
Performance-based requirements are critical and finding method conditions that meet them during development can be a challenge. For instance, if you are developing a GC-MS method for a list of compounds that contain isobaric analytes, chromatographic resolution is essential. In the example shown in Figure 3, the polychlorinated biphenyl (PCB) congeners PCB 28 and PCB 31 must be resolved in order to be detected because the mass spectrometer would not be able to distinguish one from the other. You can see that the Pro EZGC modeling software predicted the necessary separation shown in the empirical data. The Pro EZGC chromatogram simulator even accurately accounts for the vacuum the mass spectrometer is drawing at the end of the column. Using GC modeling software during method development to simulate critical separations helps ensure that QC performance requirements will be met during actual sample analysis.
Figure 3: Using GC modeling software for method development assures performance criteria will be met.
| Column | Rxi-XLB, 30 m, 0.25 mm ID, 0.25 µm (cat.# 13723) |
|---|---|
| Standard/Sample | PCB congener standard #2 (cat.# 32294) |
| PCB 31 (custom) | |
| Diluent: | Dichloromethane |
| Conc.: | 3.5 ppm |
| Injection | |
| Inj. Vol.: | 0.5 µL splitless (hold 1.75 min) |
| Liner: | 2.0 mm ID straight inlet liner w/wool (cat.# 21718) |
| Inj. Temp.: | 300 °C |
| Purge Flow: | 50 mL/min |
| Oven | |
| Oven Temp.: | 40 °C (hold 2 min) to 240 °C at 30 °C/min (hold 2 min) to 340 °C at 10 °C/min (hold 5 min) |
| Carrier Gas | He, constant flow |
| Flow Rate: | 1 mL/min |
| Detector | MS |
|---|---|
| Mode: | Scan |
| Transfer Line Temp.: | 300 °C |
| Analyzer Type: | Quadrupole |
| Source Temp.: | 280 °C |
| Electron Energy: | 70 eV |
| Ionization Mode: | EI |
| Scan Range: | 45-550 amu |
| Scan Rate: | 5 scans/sec |
| Instrument | PE Clarus 500 GC & Clarus 500 MS |
Example 3: Pro EZGC Software Predicts Correct Elution Order and Relative Retention Times, Even for Sensitive Compounds
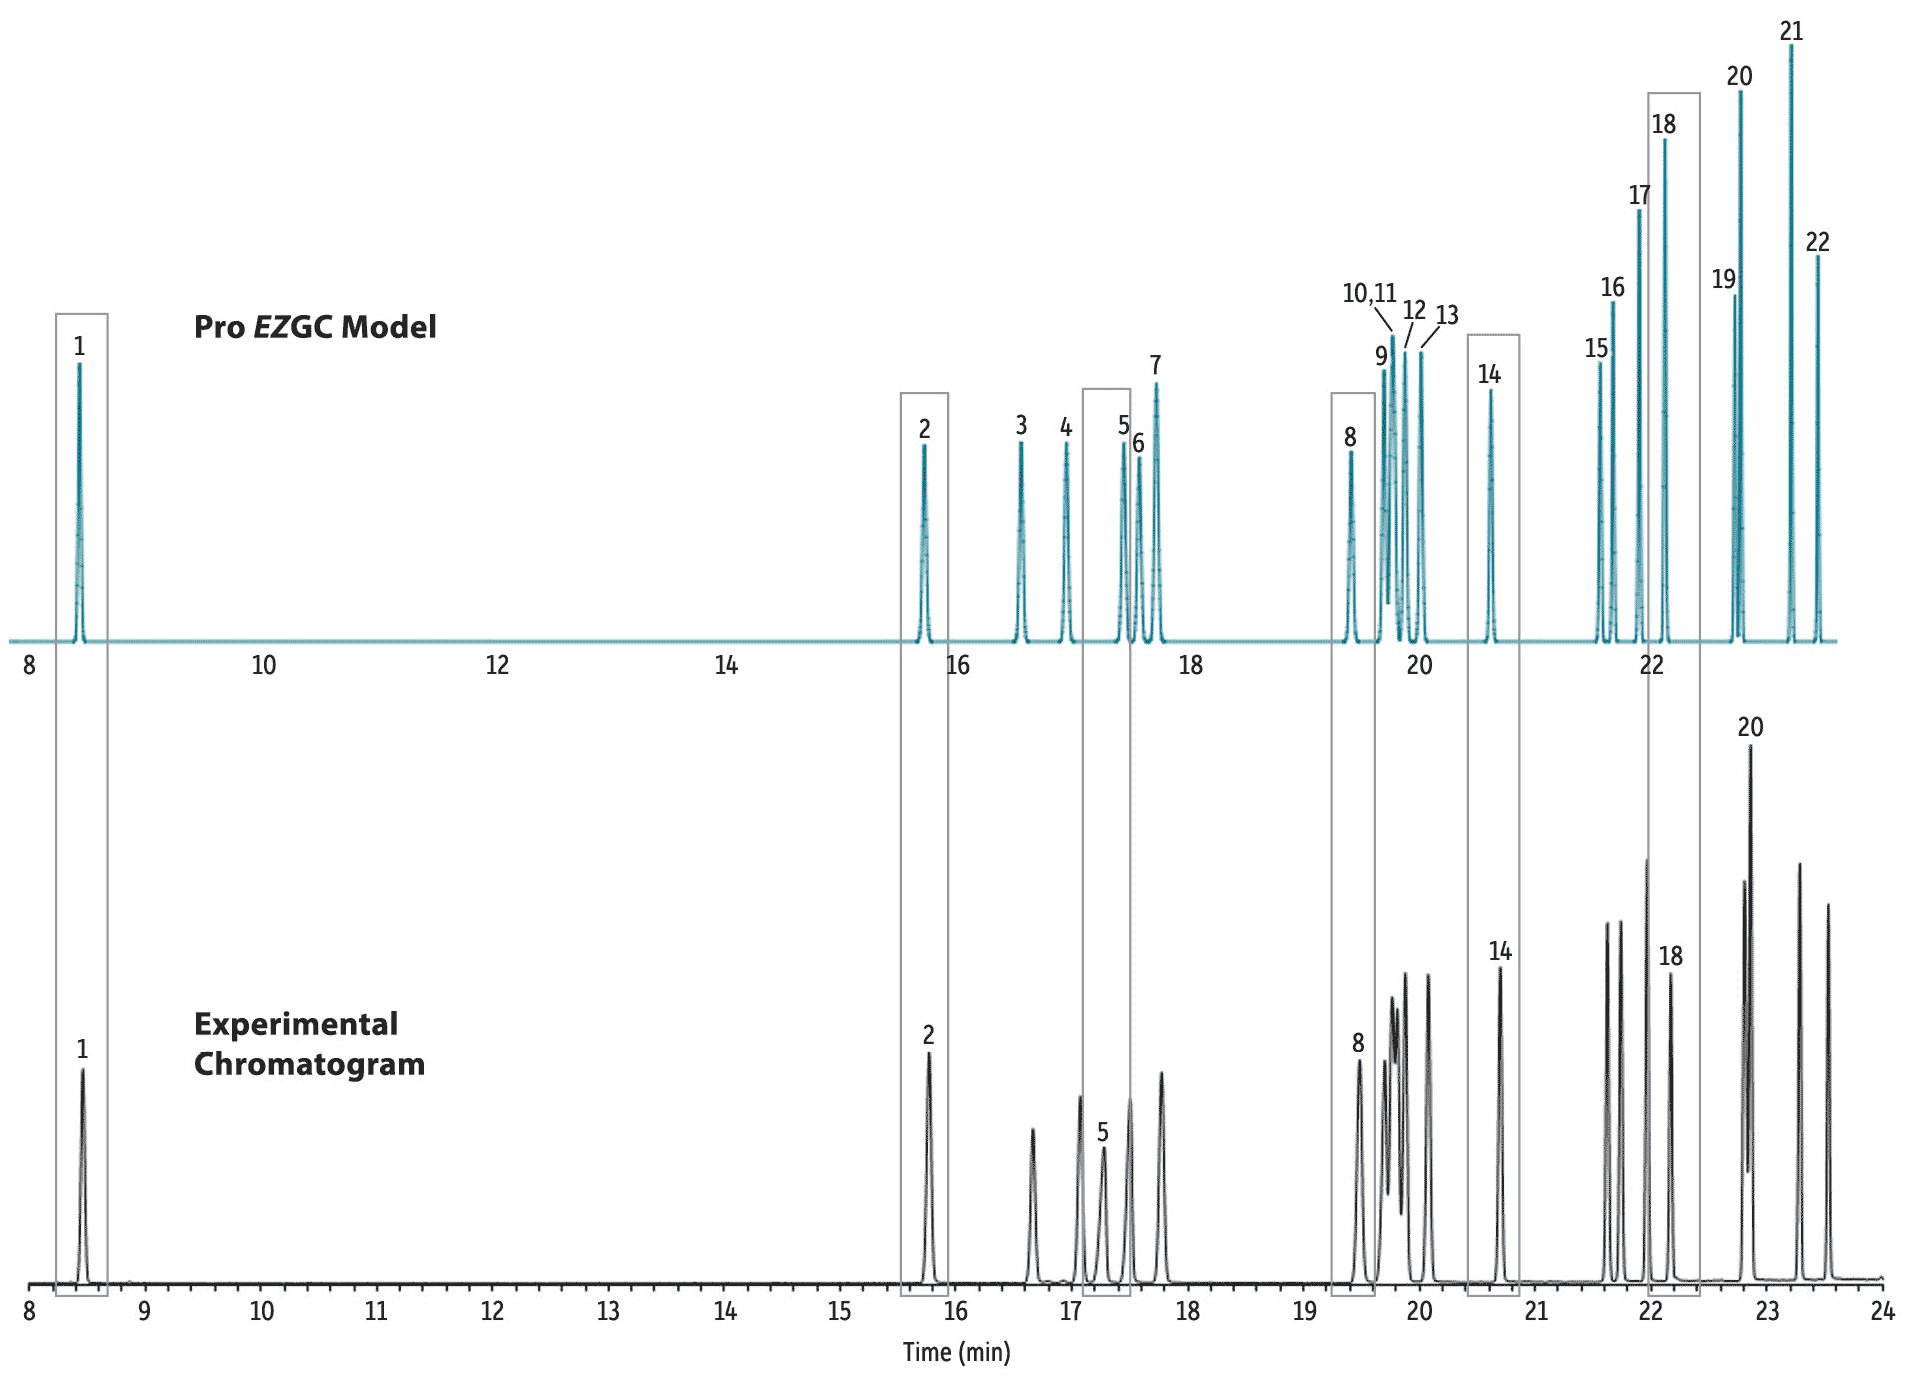
The elution of some compounds is very sensitive to column characteristics and conditions. Can GC modeling software accurately simulate elution order and relative retention times in these cases? The example in Figure 4 demonstrates that the Pro EZGC chromatogram simulator predicted the correct elution order and relative retention times for a set of pesticides that are notoriously sensitive to column conditions. The Pro EZGC software even achieves very similar resolution values compared to the experimental data. For GC method development, this means that method performance can be accurately predicted in minutes from your desk instead of by spending hours fine-tuning separations at the bench.
Figure 4: The elution of sensitive compounds can be accurately predicted using Restek’s Pro EZGC chromatogram simulator.
| Peaks | tR (min) | Conc. (mg/mL) | |
|---|---|---|---|
| 1. | EPTC | 8.462 | 100 |
| 2. | Propachlor | 15.768 | 100 |
| 3. | Ethalfluralin | 16.665 | 100 |
| 4. | Trifluralin | 17.074 | 100 |
| 5. | Desisopropyl-atrazine | 17.278 | 100 |
| 6. | Desethyl-atrazine | 17.503 | 100 |
| 7. | Phorate | 17.776 | 100 |
| 8. | Prometon | 19.485 | 100 |
| 9. | Simazine | 19.702 | 100 |
| 10. | Terbufos | 19.767 | 100 |
| 11. | Atrazine | 19.810 | 100 |
| Peaks | tR (min) | Conc. (mg/mL) | |
|---|---|---|---|
| 12. | Propazine | 19.880 | 100 |
| 13. | Fonofos | 20.079 | 100 |
| 14. | Triallate | 20.700 | 100 |
| 15. | Dimethenamid | 21.624 | 100 |
| 16. | Acetochlor | 21.741 | 100 |
| 17. | Alachlor | 21.968 | 100 |
| 18. | Metribuzin | 22.172 | 100 |
| 19. | Metolachlor | 22.810 | 100 |
| 20. | Chlorpyrifos | 22.861 | 100 |
| 21. | Cyanazine | 23.286 | 100 |
| 22. | Pendimethalin | 23.532 | 100 |
| Column | Rtx-440, 30 m, 0.25 mm ID, 0.25 µm (cat.# 12923) |
|---|---|
| Standard/Sample | Minnesota Ag List 1 pesticide kit (cat.# 32408) |
| Diluent: | Acetone |
| Conc.: | 100 ppm |
| Injection | |
| Inj. Vol.: | 1 µL split (split ratio 25:1) |
| Liner: | Premium 4 mm Precision liner w/wool (cat.# 23305) |
| Inj. Temp.: | 300 °C |
| Oven | |
| Oven Temp.: | 100 °C (hold 0.5 min) to 175 °C at 4 °C/min to 250 °C at 14.5 °C/min |
| Carrier Gas | He, constant flow |
| Flow Rate: | 2.0 mL/min |
| Detector | MS | ||||||||
|---|---|---|---|---|---|---|---|---|---|
| Mode: | Scan | ||||||||
| Scan Program: | |||||||||
| |||||||||
| Transfer Line Temp.: | 300 °C | ||||||||
| Analyzer Type: | Quadrupole | ||||||||
| Source Type: | Inert | ||||||||
| Drawout Plate: | 6 mm ID | ||||||||
| Source Temp.: | 250 °C | ||||||||
| Quad Temp.: | 180 °C | ||||||||
| Electron Energy: | 70 eV | ||||||||
| Solvent Delay Time: | 1.6 min | ||||||||
| Tune Type: | PFTBA | ||||||||
| Ionization Mode: | EI | ||||||||
| Instrument | Agilent 7890A GC & 5975C MSD | ||||||||
Example 4: Wide Variety of Column Phases in the Pro EZGC Modeler Lets You Try before Buying
Numerous GC column stationary phases have been developed over the years because their distinct selectivities provide important differences in separations. Different phases can provide improved chromatographic performance for specific analytes and, in some cases, initial results must be confirmed via an analysis on a secondary column of different selectivity. Confirmation analysis with a second column that provides retention time and elution order changes is often performed when using some detectors, such as FIDs or ECDs, because a greater degree of confidence is achieved when target analytes are observed in both analyses.
The Pro EZGC chromatogram simulator includes a wide range of column phases (Table I) that differ significantly in selectivity. Because Pro EZGC modeling software includes a diverse range of compound libraries and column phases, GC method developers can use the tool to test the performance of different columns and buy only the ones that provide optimal selectivity for their own specific target analytes.
Table I: Current phases and compound libraries available in the Pro EZGC chromatogram modeler.
|
Phases |
Compound Classes |
|
Rxi-17 |
Flavors & Fragrances |
|
Rxi-17Sil MS |
Polycyclic Aromatic Hydrocarbons (PAHs), Flavors & Fragrances |
|
Rxi-35Sil MS |
Phthalates |
|
Rxi-5Sil MS |
Polychlorinated Biphenyls (PCBs), Semivolatile Organic Compounds (SVOCs) |
|
Rxi-5ms |
Semivolatile Organic Compounds (SVOCs), Pesticides |
|
Rxi-624Sil MS |
Volatile Organic Compounds (VOCs) |
|
Rxi-PAH |
Polycyclic Aromatic Hydrocarbons (PAHs) |
|
Rxi-XLB |
Polychlorinated Biphenyls (PCBs) |
|
Rtx-1 |
Solvents, Flavors & Fragrances, Drugs, Pesticides, Volatile Organic Compounds (VOCs) |
|
Rtx-1614 |
Flame Retardants (FRs) |
|
Rtx-1701 |
Herbicides |
|
Rtx-200 |
Drugs |
|
Rtx-35 |
Drugs, Pesticides, Herbicides, Polychlorinated Biphenyls (PCBs) |
|
Rtx-440 |
Pesticides & Herbicides, Polychlorinated Biphenyls (PCBs) |
|
Rtx-5 |
Drugs, Pesticides, Herbicides, Semivolatile Organic Compounds (SVOCs) |
|
Rtx-50 |
Drugs, Pesticides, Polychlorinated Biphenyls (PCBs) |
|
Rtx-502.2 |
Volatile Organic Compounds (VOCs), Solvents |
|
Rtx-624 |
Volatile Organic Compounds (VOCs) |
|
Rtx-CLPesticides |
Pesticides |
|
Rtx-CLPesticides2 |
Pesticides |
|
Rtx-OPPesticides |
Organophosphorus Pesticides (OPPs) |
|
Rtx-OPPesticides2 |
Organophosphorus Pesticides (OPPs) |
|
Rtx-PCB |
Polychlorinated Biphenyls (PCBs), Pesticides |
|
Rtx-VMS |
Volatile Organic Compounds (VOCs), Halocarbons, Hydrocarbons, Alcohols, Aldehydes, Ethers & Esters, "Acetates Plus," Glycol Ethers, Alkanes |
|
Rtx-VRX |
Volatile Organic Compounds (VOCs) |
|
Rtx-XLB |
Pesticides & Semivolatile Organic Compounds (SVOCs) |
|
Rt-2560 |
Food Fatty Acid Methyl Esters (FAMEs) |
|
RT-2330 |
Fatty Acid Methyl Esters (FAMEs) |
|
Stabilwax |
Solvents, Flavors & Fragrances, Fatty Acid Methyl Esters (FAMEs) |
Example 5: Pro EZGC Chromatogram Simulator Gives an Excellent Overall Match, Even for Different Experimental Setups
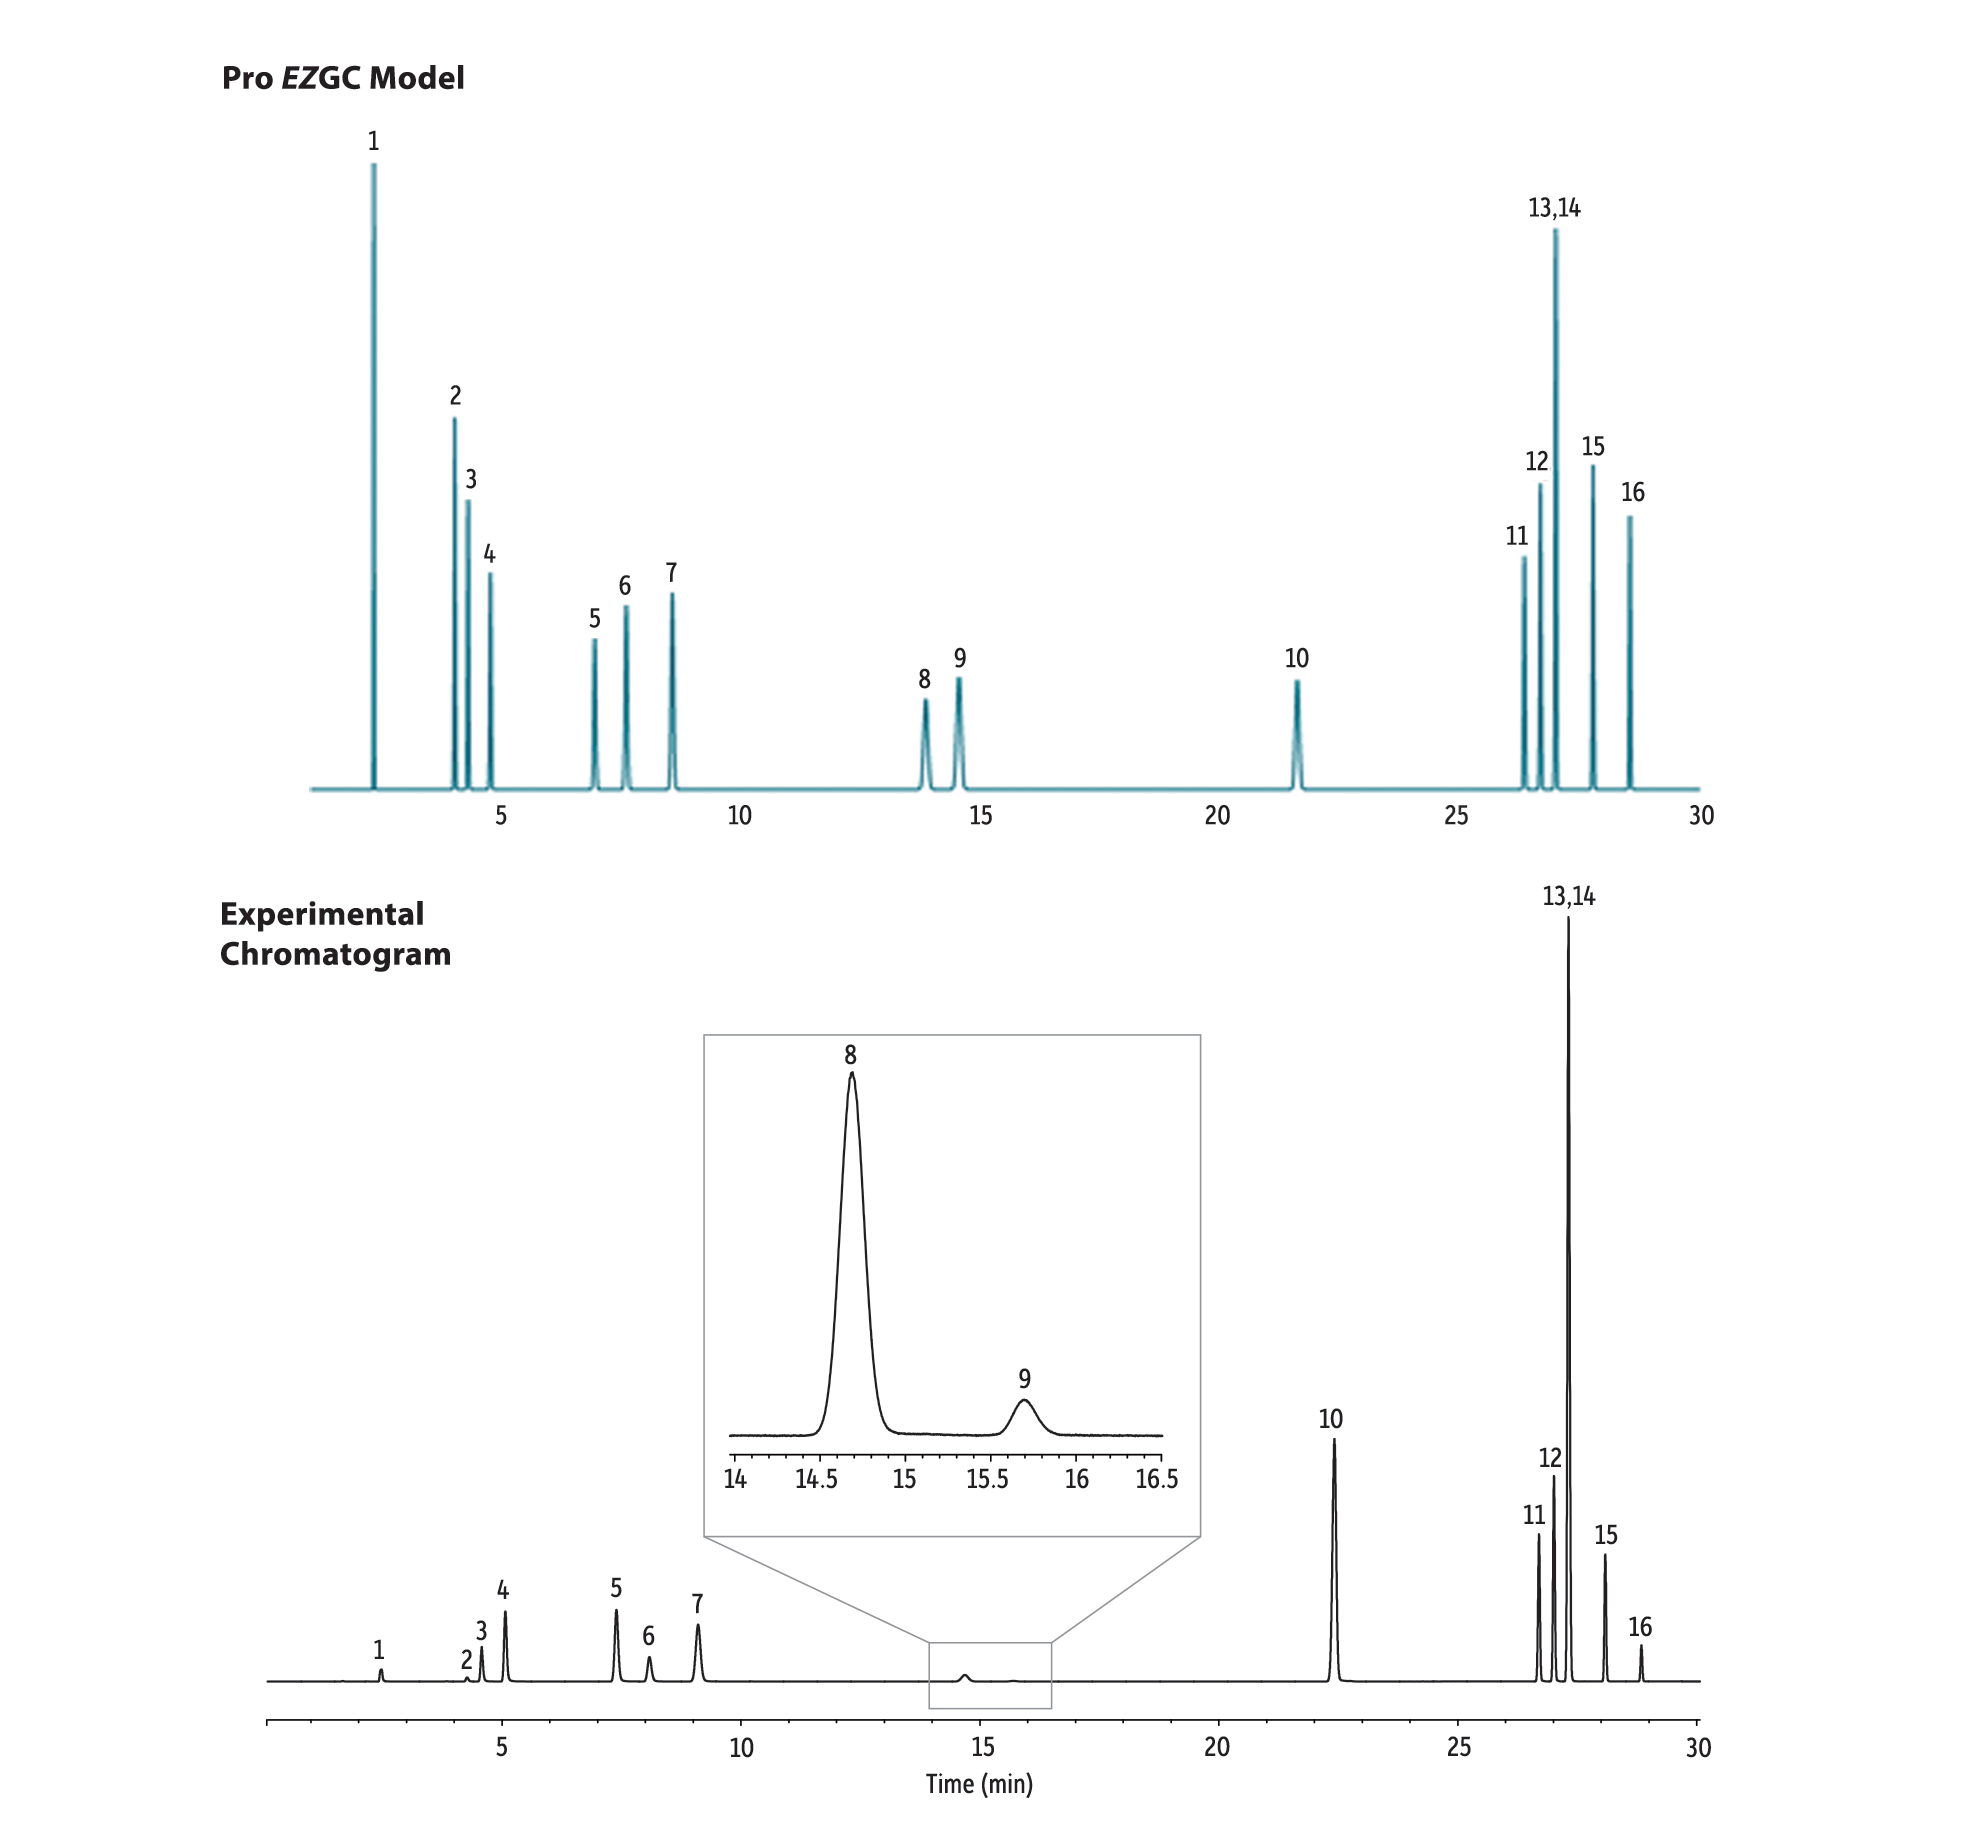
This final example illustrates that some experimental setups will generate slightly different results than the Pro EZGC model but, even in these situations, the match is excellent and provides a great starting place for GC method development. The Pro EZGC modeling software assumes an ideal split/splitless sample introduction onto the column, so in a case where the actual sample was introduced via headspace with a sampling loop, there are differences in retention time that result from the additional time required to transfer the sample to the column. Peak widths may also increase due to band broadening that occurs during the sample introduction process. As shown in Figure 5, despite these differences, the Pro EZGC chromatogram simulator produces a very close match to the experimental separation in terms of relative peak resolution. This allows method developers, who will ultimately use a different sample introduction technique, to still benefit from using Pro EZGC modeling software.
Figure 5: While exact retention times shifted due to the use of a headspace sampling loop, the overall separation predicted by the Pro EZGC chromatogram modeler is very close to the actual experimental results.
| Peaks | |
|---|---|
| 1. | Methanol |
| 2. | Acetonitrile |
| 3. | Methylene chloride |
| 4. | trans-1,2-Dichloroethene |
| 5. | cis-1,2-Dichloroethene |
| 6. | Tetrahydrofuran |
| 7. | Cyclohexane |
| 8. | Methylcyclohexane |
| Peaks | |
|---|---|
| 9. | 1,4-Dioxane |
| 10. | Toluene |
| 11. | Chlorobenzene |
| 12. | Ethylbenzene |
| 13. | m-Xylene |
| 14. | p-Xylene |
| 15. | o-Xylene |
| 16. | Cumene |
| Column | Rxi-624Sil MS, 30 m, 0.32 mm ID, 1.80 µm (cat.# 13870) |
|---|---|
| Standard/Sample | Residual solvents Class 2 — Mix A (2013 Rev) (cat.# 36012) |
| Diluent: | Water |
| Injection | |
| Inj. Vol.: | 1,000 µL headspace-loop split (split ratio 5:1) |
| Liner: | Premium 1.0 mm ID straight inlet liner (cat.# 23333) |
| Inj. Port Temp.: | 140 °C |
| Headspace-Loop | |
| Instrument: | Tekmar HT-3 |
| Inj. Time: | 1.0 min |
| Transfer Line Temp.: | 105 °C |
| Valve Oven Temp.: | 105 °C |
| Needle Temp.: | 85 °C |
| Sample Temp.: | 80 °C |
| Sample Equil. Time: | 60 min |
| Mixer time: | 5.0 min |
| Mixing level: | 5 |
| Mixer stabilize time: | 0.50 min |
| Vial Pressure: | 10 psi |
| Pressurize Time: | 5.0 min |
| Pressure Equilibration Time: | 0.20 min |
| Loop Pressure: | 5.0 psi |
| Loop Fill Time: | 2.0 min |
| Oven | |
| Oven Temp.: | 40 °C (hold 20 min) to 240 °C at 10 °C/min (hold 20 min) |
| Carrier Gas | He, constant flow |
| Flow Rate: | 2.2 mL/min |
| Detector | FID @ 250 °C |
|---|---|
| Make-up Gas Flow Rate: | 45 mL/min |
| Make-up Gas Type: | N2 |
| Hydrogen flow: | 40 mL/min |
| Air flow: | 450 mL/min |
| Data Rate: | 20 Hz |
| Instrument | Agilent/HP6890 GC |
When Models Meet Reality
When it comes to accurately predicting the chromatographic performance of a set of compounds on a given GC column under certain conditions, nothing beats Pro EZGC modeling software. Restek’s chemists use it extensively to develop applications and, despite the fact that some real-world situations, such as sample introduction via headspace transfer lines or inaccurate flow rates, introduce variables that may require slight adjustments from the modeled results, the Pro EZGC chromatogram simulator still arrives at a modeled chromatogram and a set of conditions that serve as excellent starting conditions for any further method refinement that may be necessary.
Try it yourself for free!
All of the examples shown here are cases where the model was able to replicate empirical results with impressive accuracy. If you have a list of compounds, get started using our free Pro EZGC modeling software, and let Restek’s years of chromatographic experience do the work for you! GC method development has never been so easy.